
Caber User Console Overview & Navigation Shell
The Caber User Console provides security engineers, governance leads, and platform operators with an interactive control plane for observing agentic AI traffic, investigating subsentence provenance traces, discovering unmapped APIs and Model Context Protocol (MCP) servers, and authoring live governance policies. Every page in the console renders in both dark obsidian mode and high contrast light mode, with synchronized telemetry, interactive drill down panels, and inline configuration editors.
Workspace Organization and Route Map
The console organizes operator workflows into an initial Deployment Selector entry gate followed by three primary sidebar groups inside the administrative shell: Dashboards, Explore, and Configure.
| Workspace Group | Navigation Label | Console Route | Primary Operator Purpose |
|---|---|---|---|
| Entry Gate | Deployment Selector | / | Probe available Caber deployments, inspect agreement terms, or connect to a custom endpoint URL |
| Dashboards | Overview | /admin/home | Monitor corpus snippet coverage, interactive policy sunburst rings, four core telemetry panels, and expandable operations cards |
| Dashboards | Object Clusters & Versions | /admin/overlapping | Inspect document similarity clusters, fresh versus stale version lineage, policy boundary hulls, and side by side byte span diffs |
| Dashboards | Session Audit | /admin/audit | Filter multi hop agent conversations, inspect balloon timelines, verify On-Behalf-Of (OBO) principal attribution, and audit surgical redactions |
| Dashboards | Discovered Tools & APIs | /admin/discovery | Discover HTTP APIs, MCP servers, object stores, databases, bash commands, and scripts observed on the wire or via passive logs |
| Dashboards | Ingest Performance | /admin/scanning | Track characterization throughput, document format distributions, named entity recognition (NER) category breakdowns, and source health |
| Dashboards | Platform Status | /admin/platform | Monitor caber_core, OpenSearch, Neo4j, and storage health cards alongside filterable container and service logs |
| Explore | Context Graph | /admin/contextGraph | Execute visual Cypher queries or natural language AI graph queries against the Neo4j ontological provenance graph |
| Configure | Policies | /admin/config/policies | Author, prioritize, reorder, and simulate Contract v3 Rego and Wasm governance policies across priority bands 0 through 1000 |
| Configure | SDK Deployments | /admin/config/sdk-deployments | Manage pycaber(auto) service trust states, inspect active process instances, bind outbound hosts, and provision one time API keys |
| Configure | API Mappings | /admin/config/api-mappings | Configure ApiMap interception rules, protocol profiles, protobuf schemas, routeRules, OBO token minting, and per API policy overrides |
| Configure | Identity Sources | /admin/config/identity-sources | Register enterprise identity providers (Okta, Azure AD, Keycloak, AWS IAM, LDAP, Custom OIDC) for principal resolution |
| Configure | Object Sources | /admin/config/object-sources | Manage configured and auto discovered S3, MinIO, VersityGW, and GCS buckets with per bucket scanner and parser settings |
| Configure | Edit Configuration | /admin/config/review | Review the complete runtime JSON configuration, run AI powered validation checks, and click findings to jump to exact JSON lines |
Routable Deep Dive and Specialized Views
In addition to the primary sidebar items, the console exposes dedicated routable views that operators reach via deep links, drill down buttons, or direct URL navigation:
- Trace Detail Deep Link (
/admin/audit?traceId=<id>): Opens the trace detail slide in on the Session Audit page for a specific trace, showing freshness, provenance, and the determining policy for each retrieval step. Adding&governance=openopens the governance decision panel on load, so incident URLs can be shared directly across security teams. - Access & Authorization Matrix (
/admin/accessAuth): Displays principal authorization heatmaps,OBOtoken exchange breakdowns, and cross service access verdicts. - Data Flow & Lineage View (
/admin/dataFlow): Visualizes end to end data movement from ingested storage buckets through vector stores,MCPtools, and outbound LLM provider completions. - Environment Parameters (
/admin/config/environment): Provides a structured editor for global runtime parameters (GLOBAL,AWS, andDependenciesconfiguration blocks). - SQL Databases (
/admin/config/sql-databases): Configures relational database connectors (PostgreSQL,MySQL,Snowflake,SQLite) for structured table characterization and query governance. - Advanced Engine Settings (
/admin/config/advanced): Exposes low level WRL Chunker (RKCQFandWhitespaceRemapOnLeader), RBIX roaring bitmap index, andcsi_genai_libproxy parameters.
Deployment Selector and Instance Connection (/)
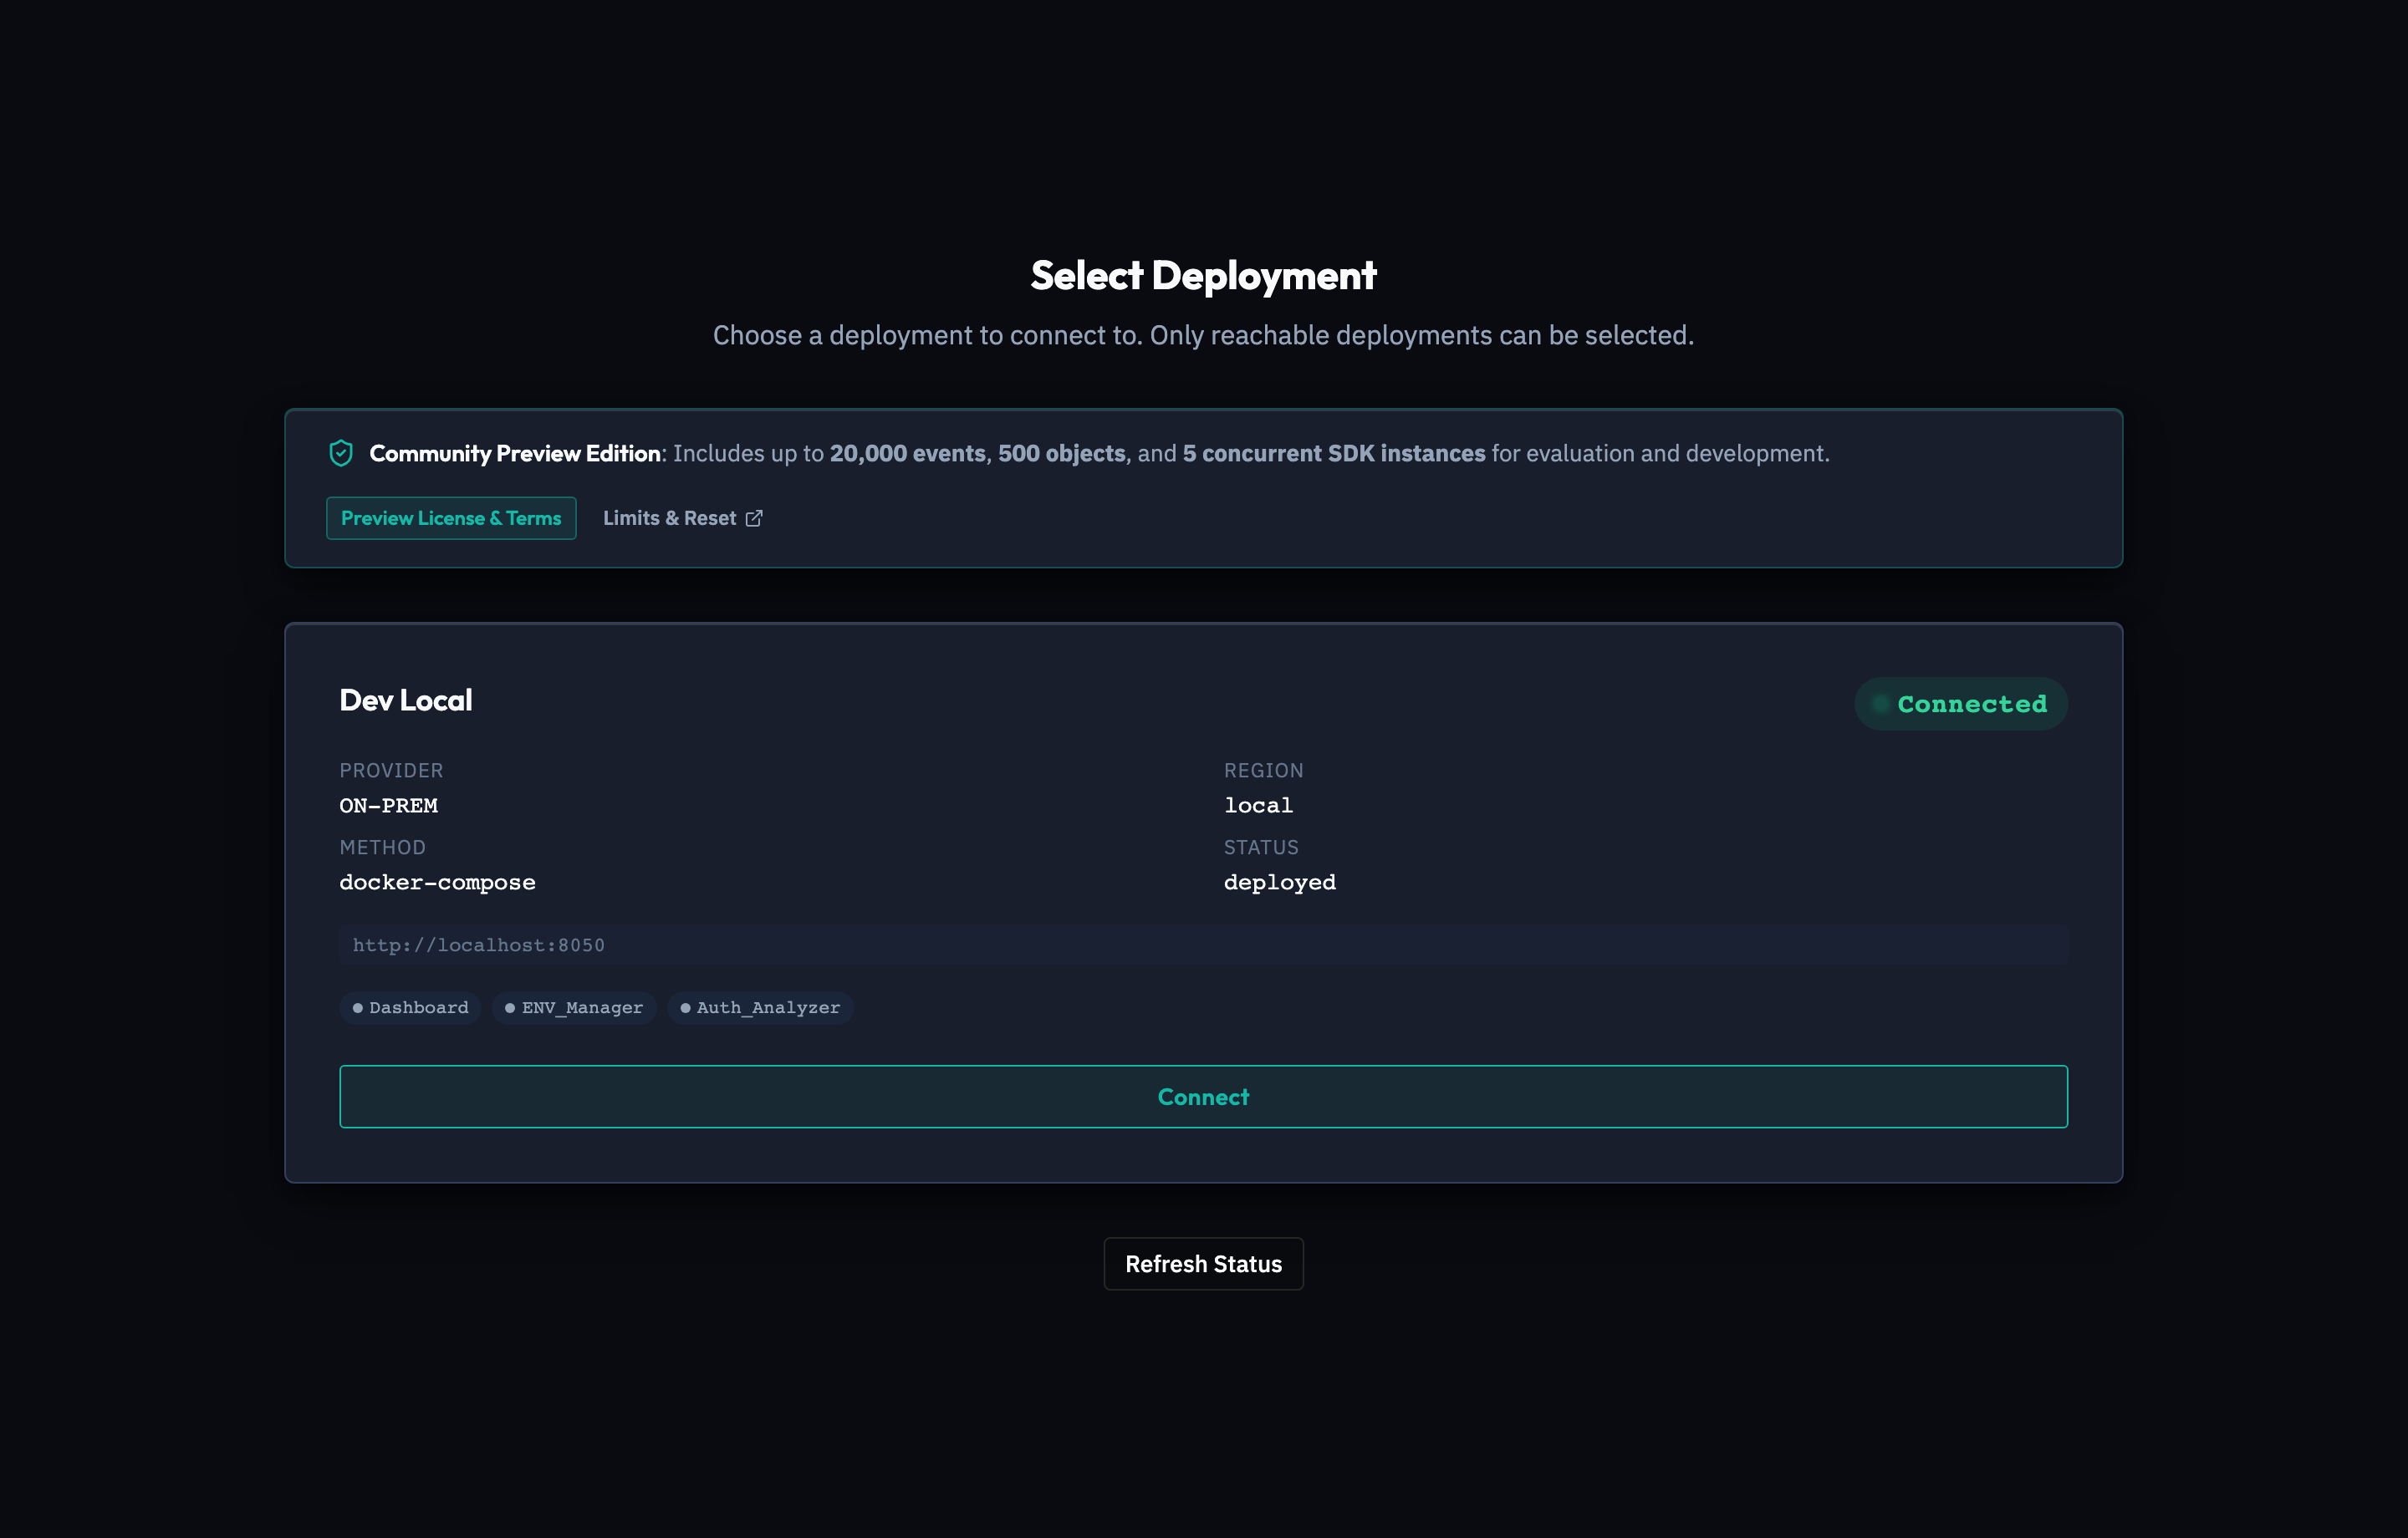
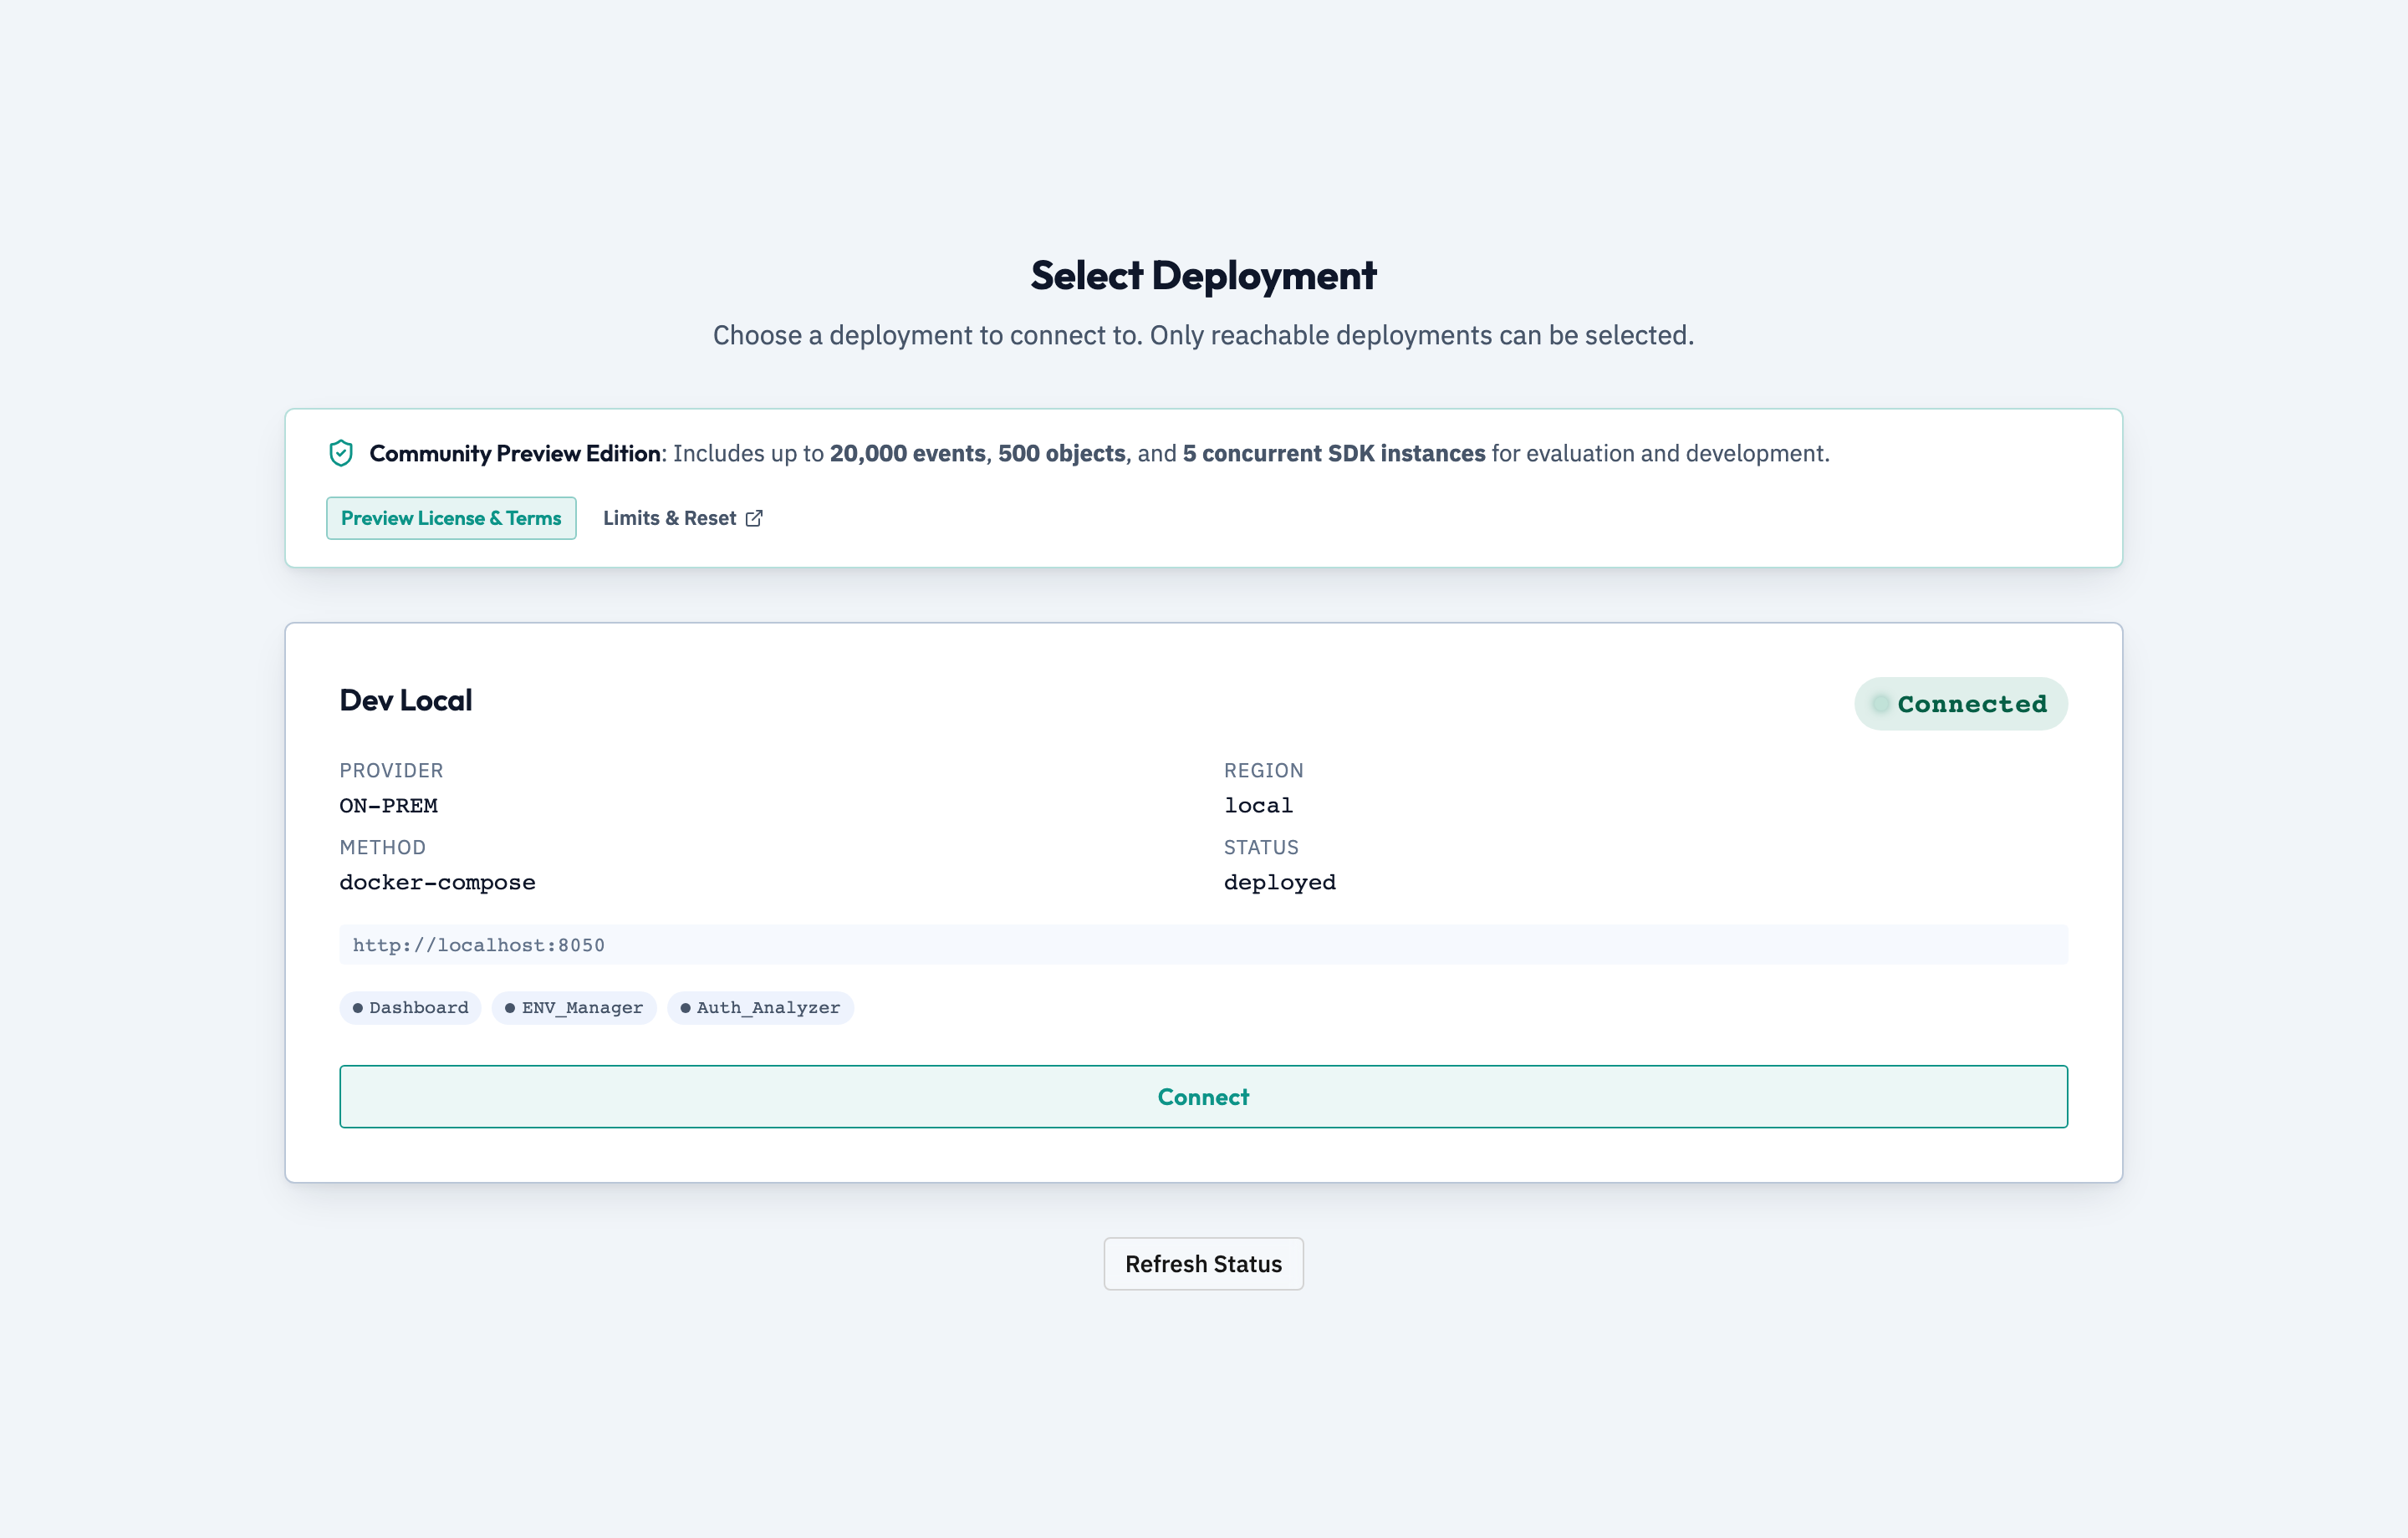
When an operator opens the console at /, the Deployment Selector screen initializes before loading the administrative workspace. This gate ensures that multi environment operators explicitly bind their session to the intended Caber deployment (such as a local developer stack, a staging cluster, or a production governance gateway).
/Deployment Mode Selector & Live Infrastructure ProbeAssertion Verified: Proves that the Caber Console probes live AWS and local cluster health on startup and allows operators to bind their session to either deployment target.
Instance Probing and Custom URL Registration
Each deployment card represents a configured target defined in the runtime instance registry (configState). On page mount, the selector executes an asynchronous health check against /api/health to verify backend reachability:
- Reachability Badges: Cards display a green
Onlineindicator when/api/healthresponds within the probe timeout, an amberCheckingpulse while the probe is in flight, or a mutedOfflinebadge when the target cannot be reached. - Connecting to an Instance: Clicking
Connecton any deployment card setsselectedInstanceIdin the console store, triggers an immediate background fetch of the runtime configuration (fetchConfig), and transitions the router to/admin/home. - Adding a Custom Deployment (
+ Connect to URL): Clicking the dashed+ Connect to URLcard expands an inline connection form with fields for Deployment Name and Endpoint URL. The form validates that the URL uses an explicithttp:orhttps:protocol scheme before registering the custom instance and connecting to/admin/home.
Preview Terms and Agreement Modal
At the top of the Deployment Selector, a translucent banner displays a Preview badge alongside a clickable Preview terms apply trigger.
/Preview Agreement & Confidentiality Acknowledgment ModalAssertion Verified: Proves that operator access to preview and evaluation deployments is gated by an explicit confidentiality and acceptable-use acknowledgment before session entry.
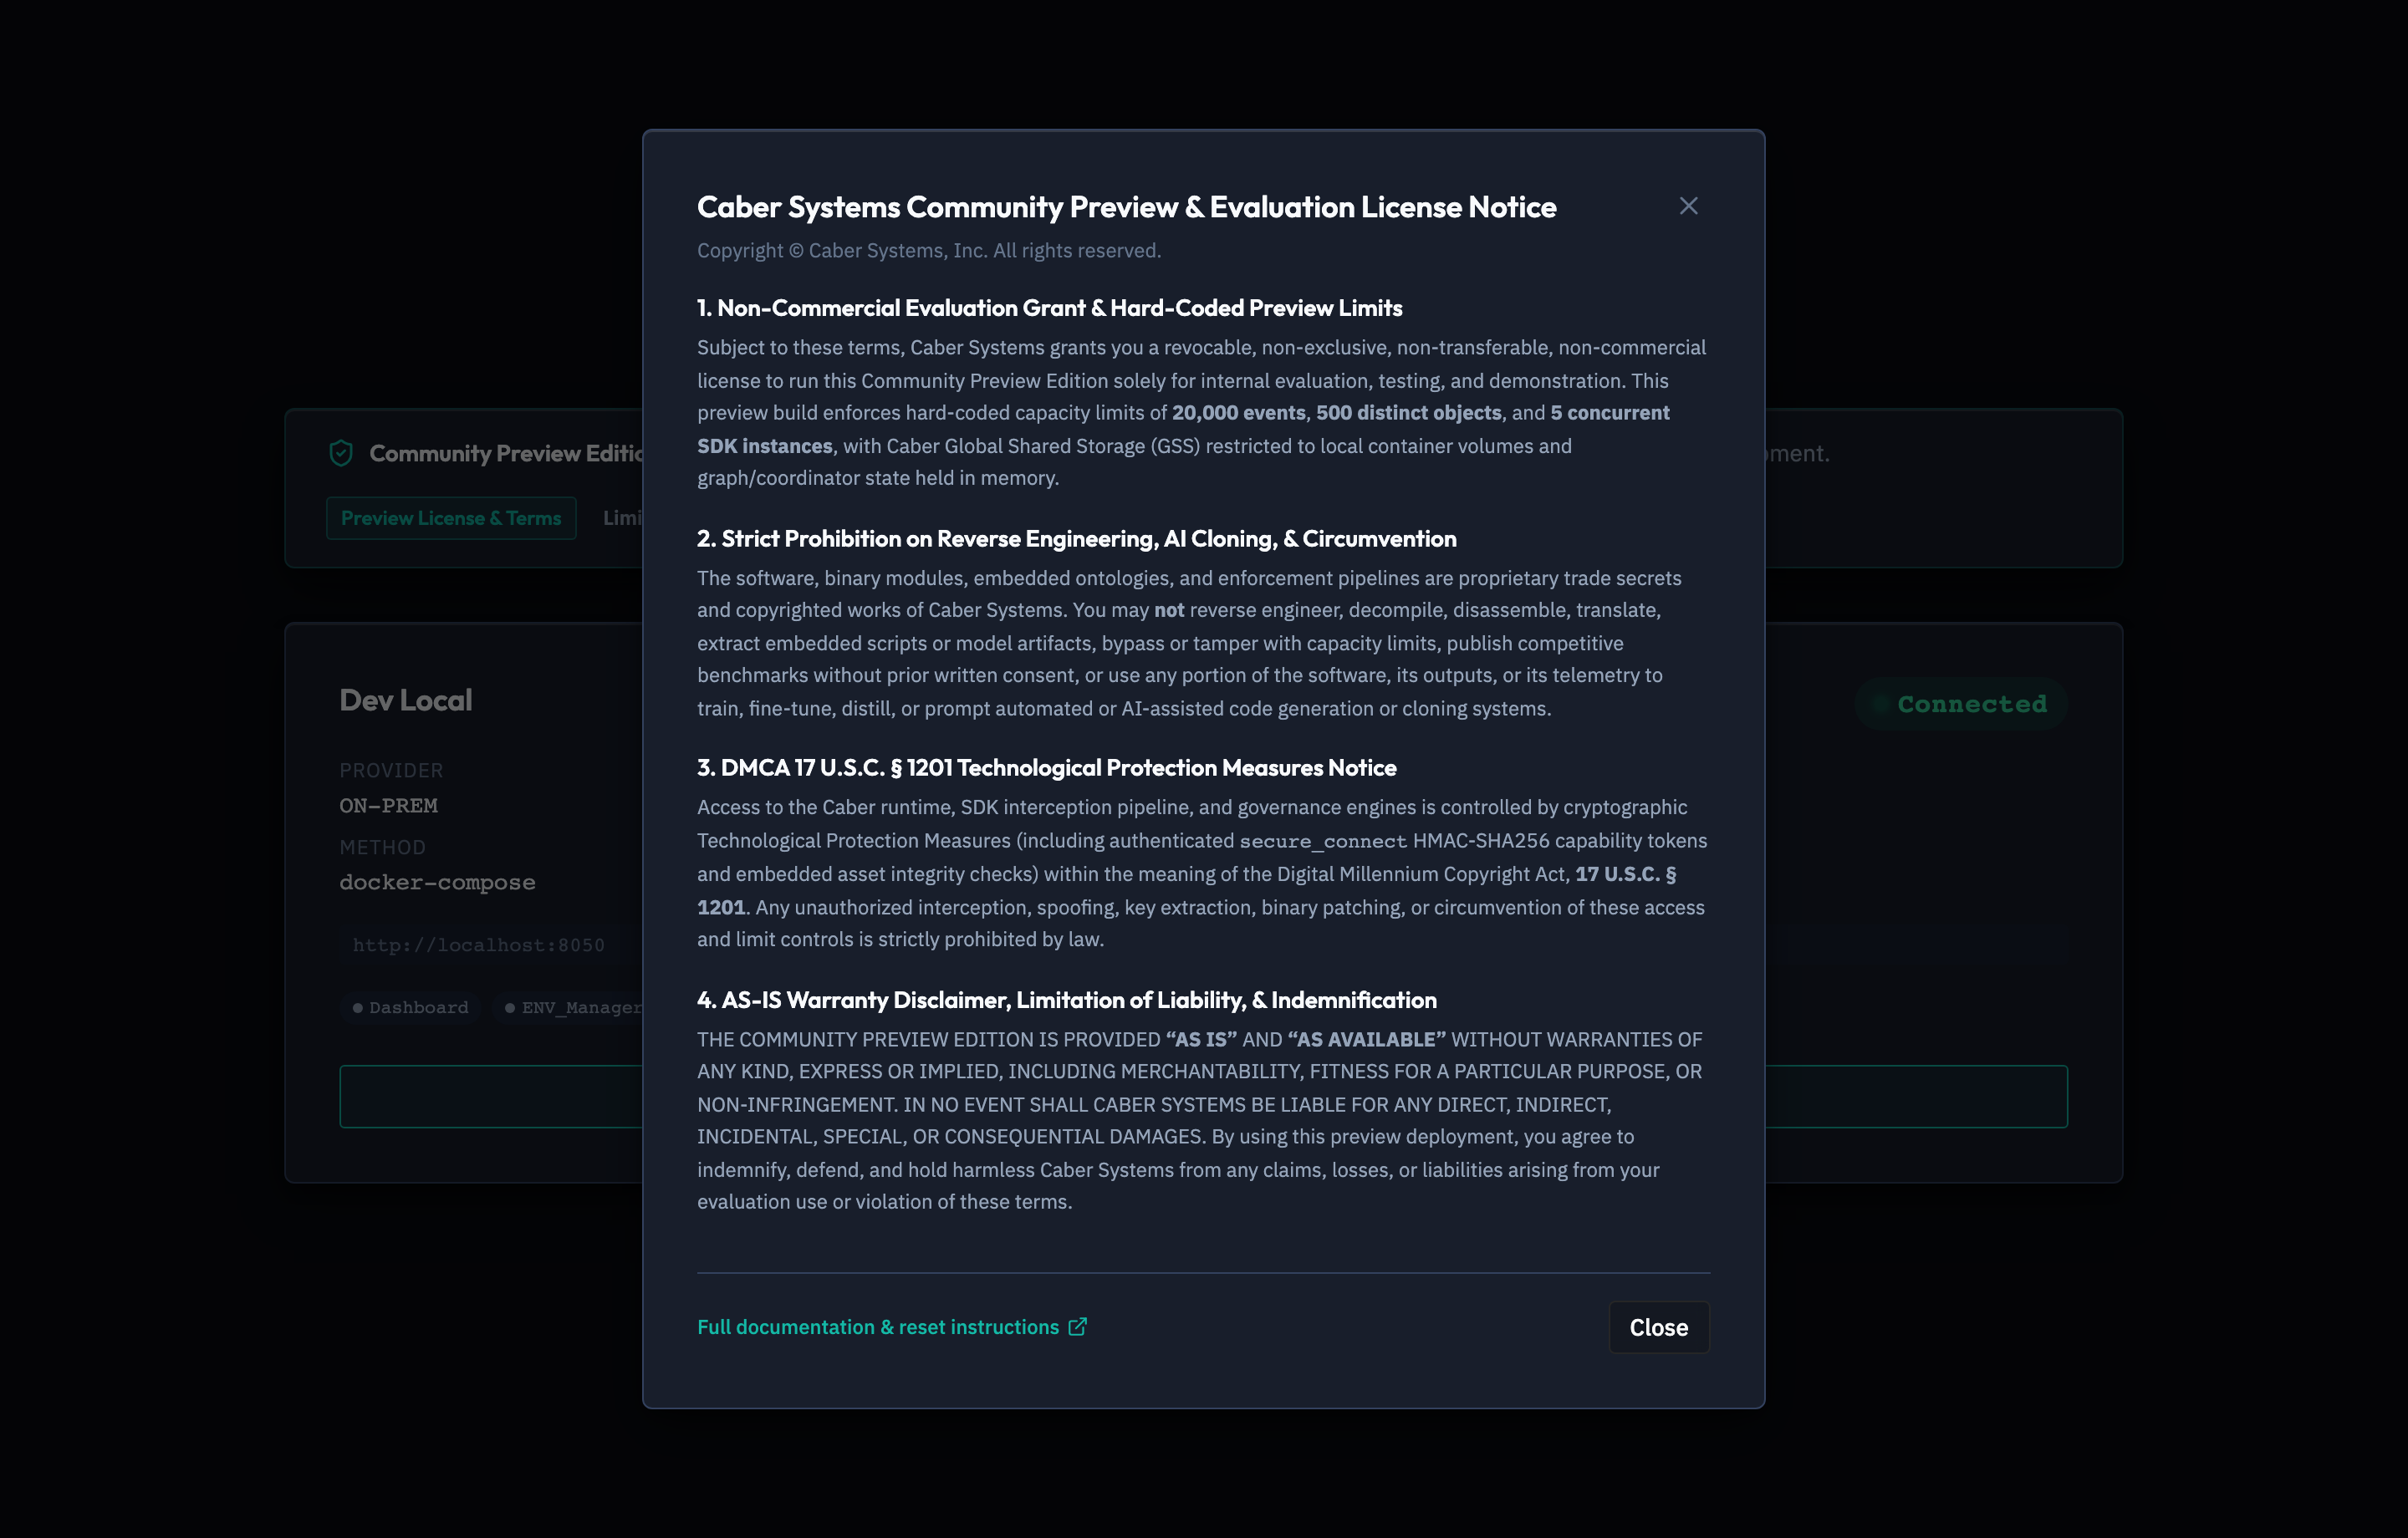
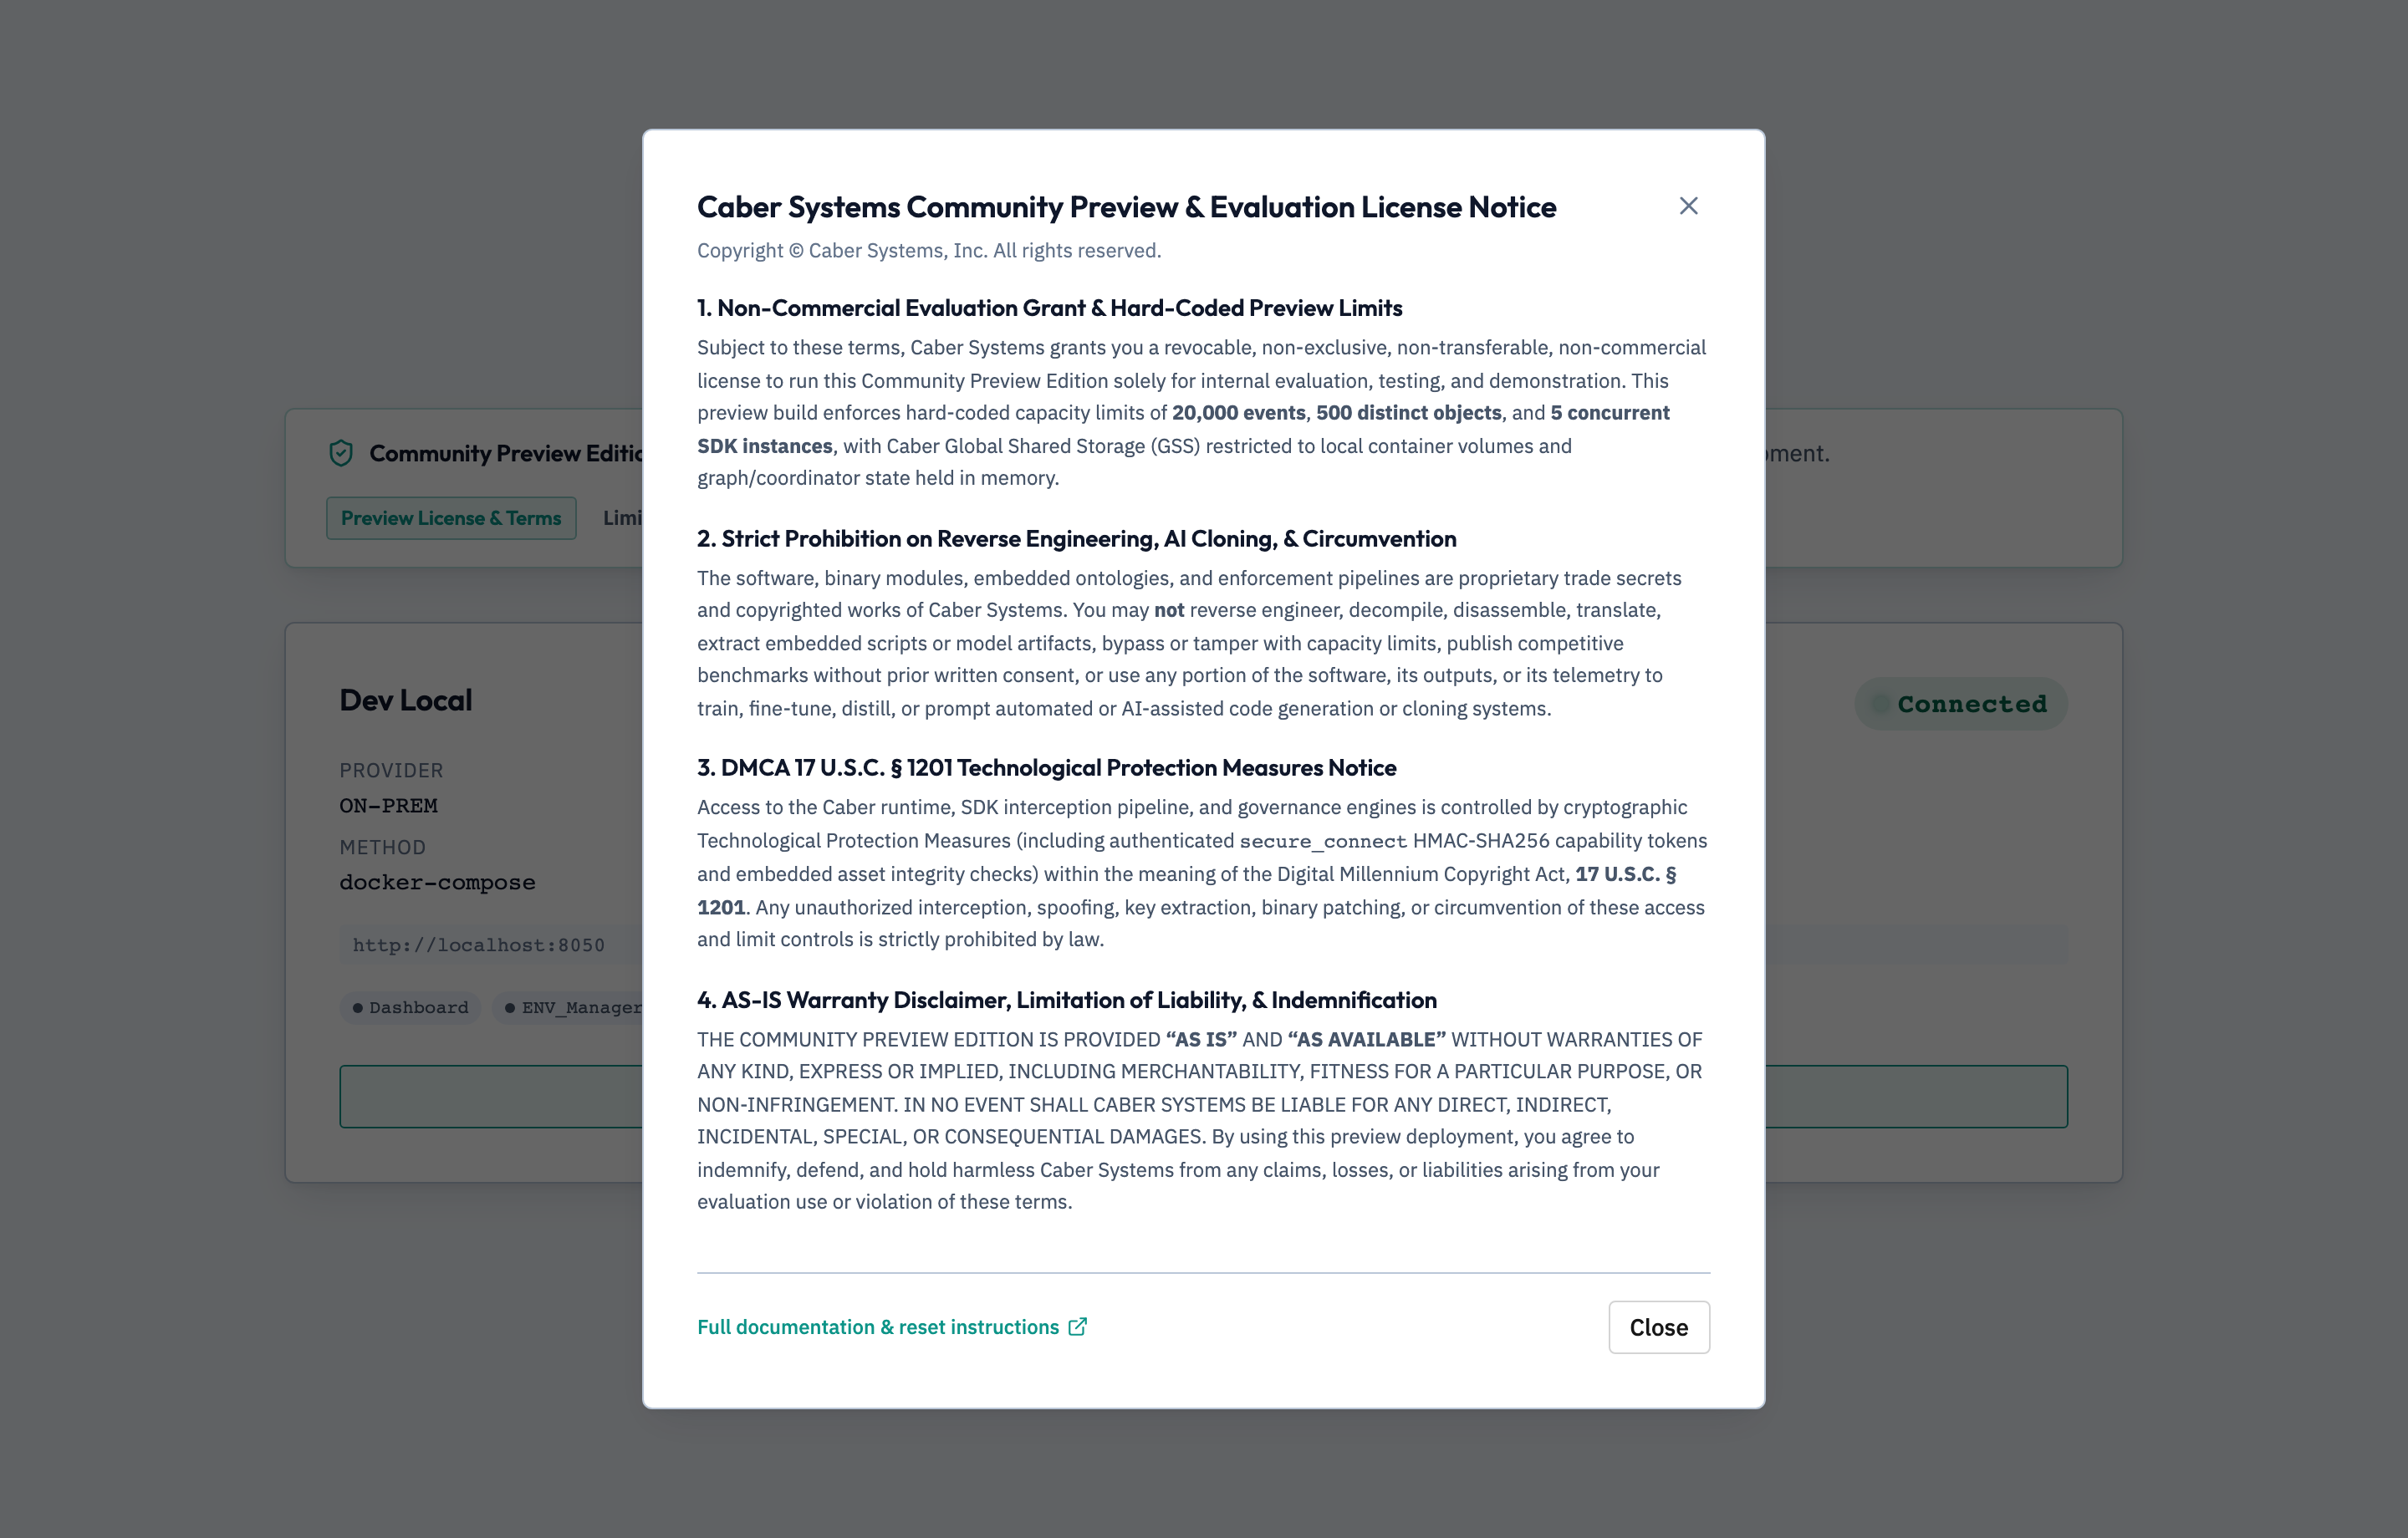
Clicking this trigger opens the Preview Agreement Modal, which presents the evaluation scope, telemetry handling disclosures, and permitted operational use terms. Operators can dismiss the modal by clicking the Close button, clicking the backdrop overlay, or pressing Escape.
Global Shell Chrome, Theme Polarity, and AI Assistant
Once connected to a deployment, every /admin/* route renders inside a unified application shell composed of the Topbar, the collapsible Sidebar, the primary workspace canvas, and the contextual AI Assistant slide in drawer.
Topbar Controls and Live Configuration Sync Status
The Topbar spans the top of the console (48px height) and provides persistent operational controls from left to right:
- Brand and Active Deployment Badge: Displays the Caber crest alongside the connected deployment name (
Dev Local,Staging, or custom host) and a green status dot. ClickingSwitchdisconnects from the current instance and returns to/. - Configuration Sync Status Pill: When the operator is inside any
/admin/config/*route, the Topbar renders a live state indicator bound toconfigState:Loading config...: Displayed with a spinning indicator while/api/v1/configis being fetched.Config sync issue: Displayed in red if the backend configuration endpoint returned an error or failed schema validation.Unsaved changes: Displayed in amber whenever the in memory draft diverges from the persisted configuration (isDirty === true), accompanied by an inlineSavebutton that commits the changes viaPUT /api/v1/config.Saved: Displayed in green when the console state matches the active runtime configuration oncaber_core.
- Theme Polarity Switch (
Dark/Light): Switches the entire console between dark obsidian mode (class="dark") and high contrast light mode (class="light"). Every chart, Cytoscape graph canvas, code viewer, and badge recalculates its semantic surface and text tokens immediately upon toggle.
Collapsible Sidebar Navigation
The left Sidebar organizes routes into Dashboards, Explore, and Configure sections:
- Expanded Mode (
220px): Shows section headers, route icons, and full text labels, highlighting the active route with a left accent bar and elevated surface fill. - Collapsed Rail Mode (
60px): Clicking the collapse chevron at the bottom of the sidebar condenses the navigation into a compact icon rail with hover tooltips, maximizing horizontal screen real estate for wide forensic timelines (/admin/audit), side by side document comparisons (/admin/overlapping), and dense JSON configuration reviews (/admin/config/review).
Contextual Ask AI Configuration Assistant Drawer
Every configuration section card (ConfigSection) across /admin/config/* pages exposes an Ask AI button (Sparkles icon) in its top right header. Clicking Ask AI opens a 384px slide in AI Assistant drawer (AiAssistantPanel) anchored to the right edge of the viewport and scoped to that specific configuration section and field.
/admin/config/environmentEnvironment Configuration & Contextual Ask AI Assistant DrawerAssertion Verified: Proves that operators can inspect global environment settings and invoke the contextual Ask AI Assistant drawer from any console screen to query configuration state and troubleshooting guidance.
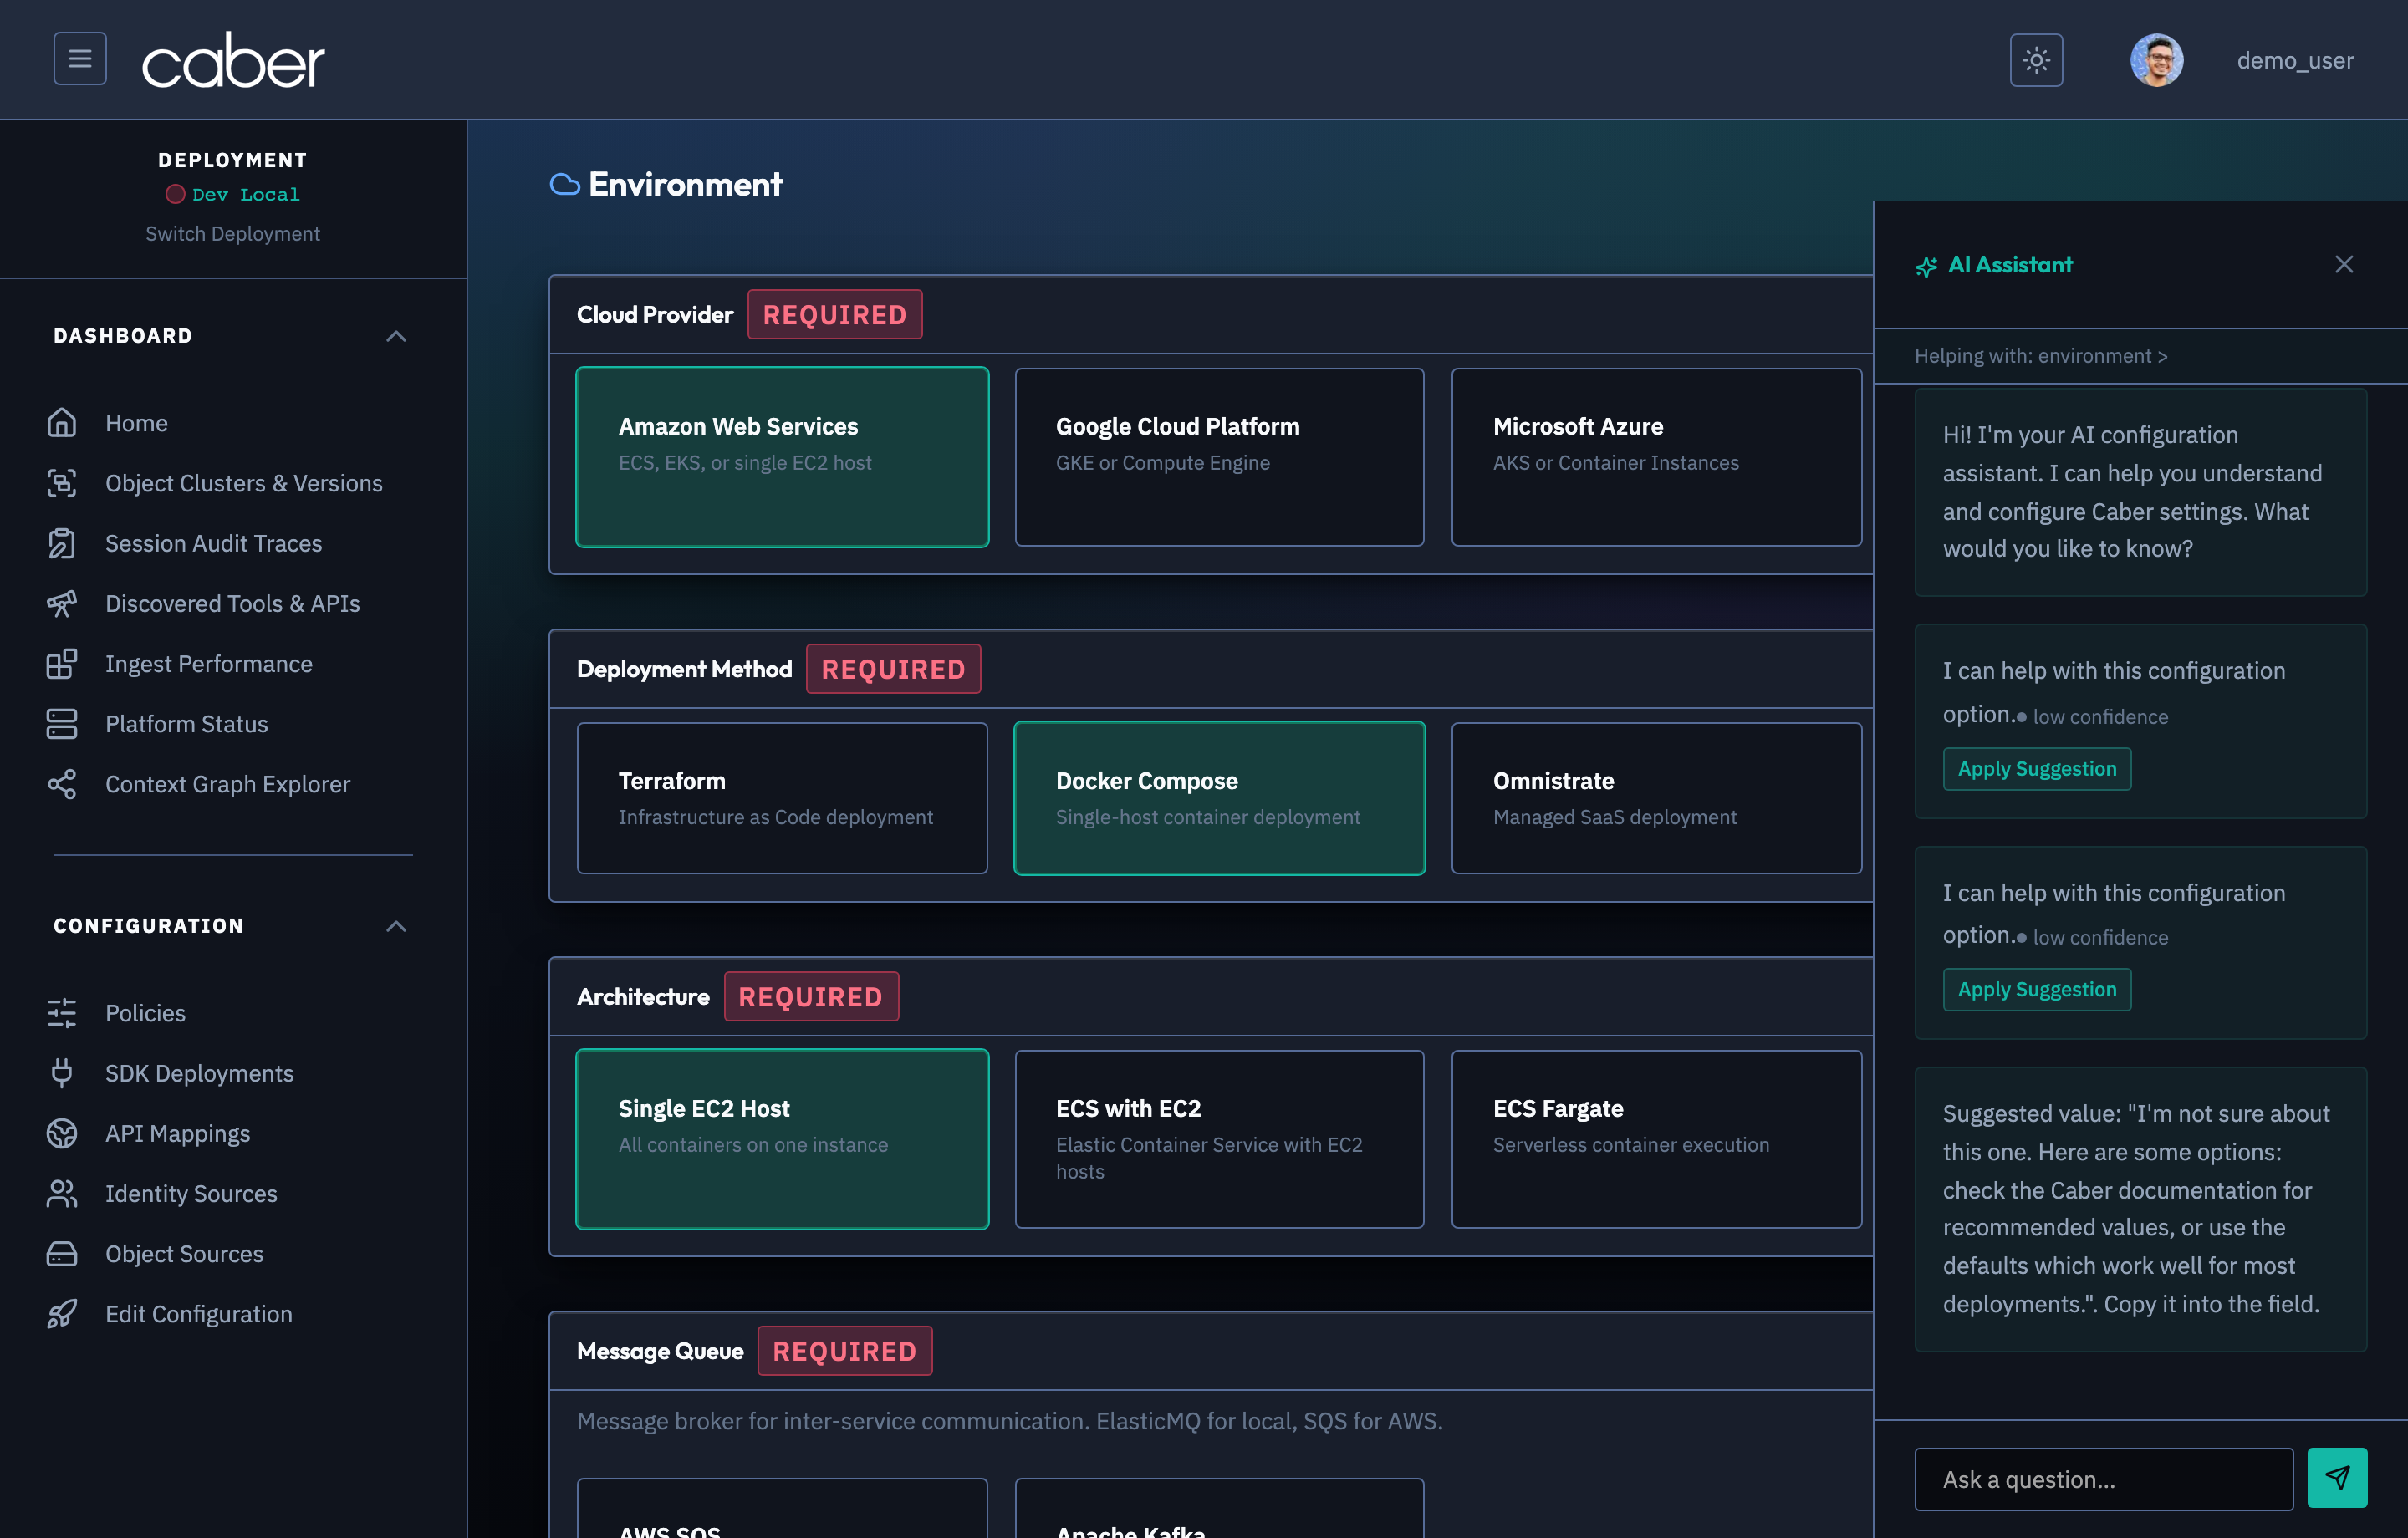
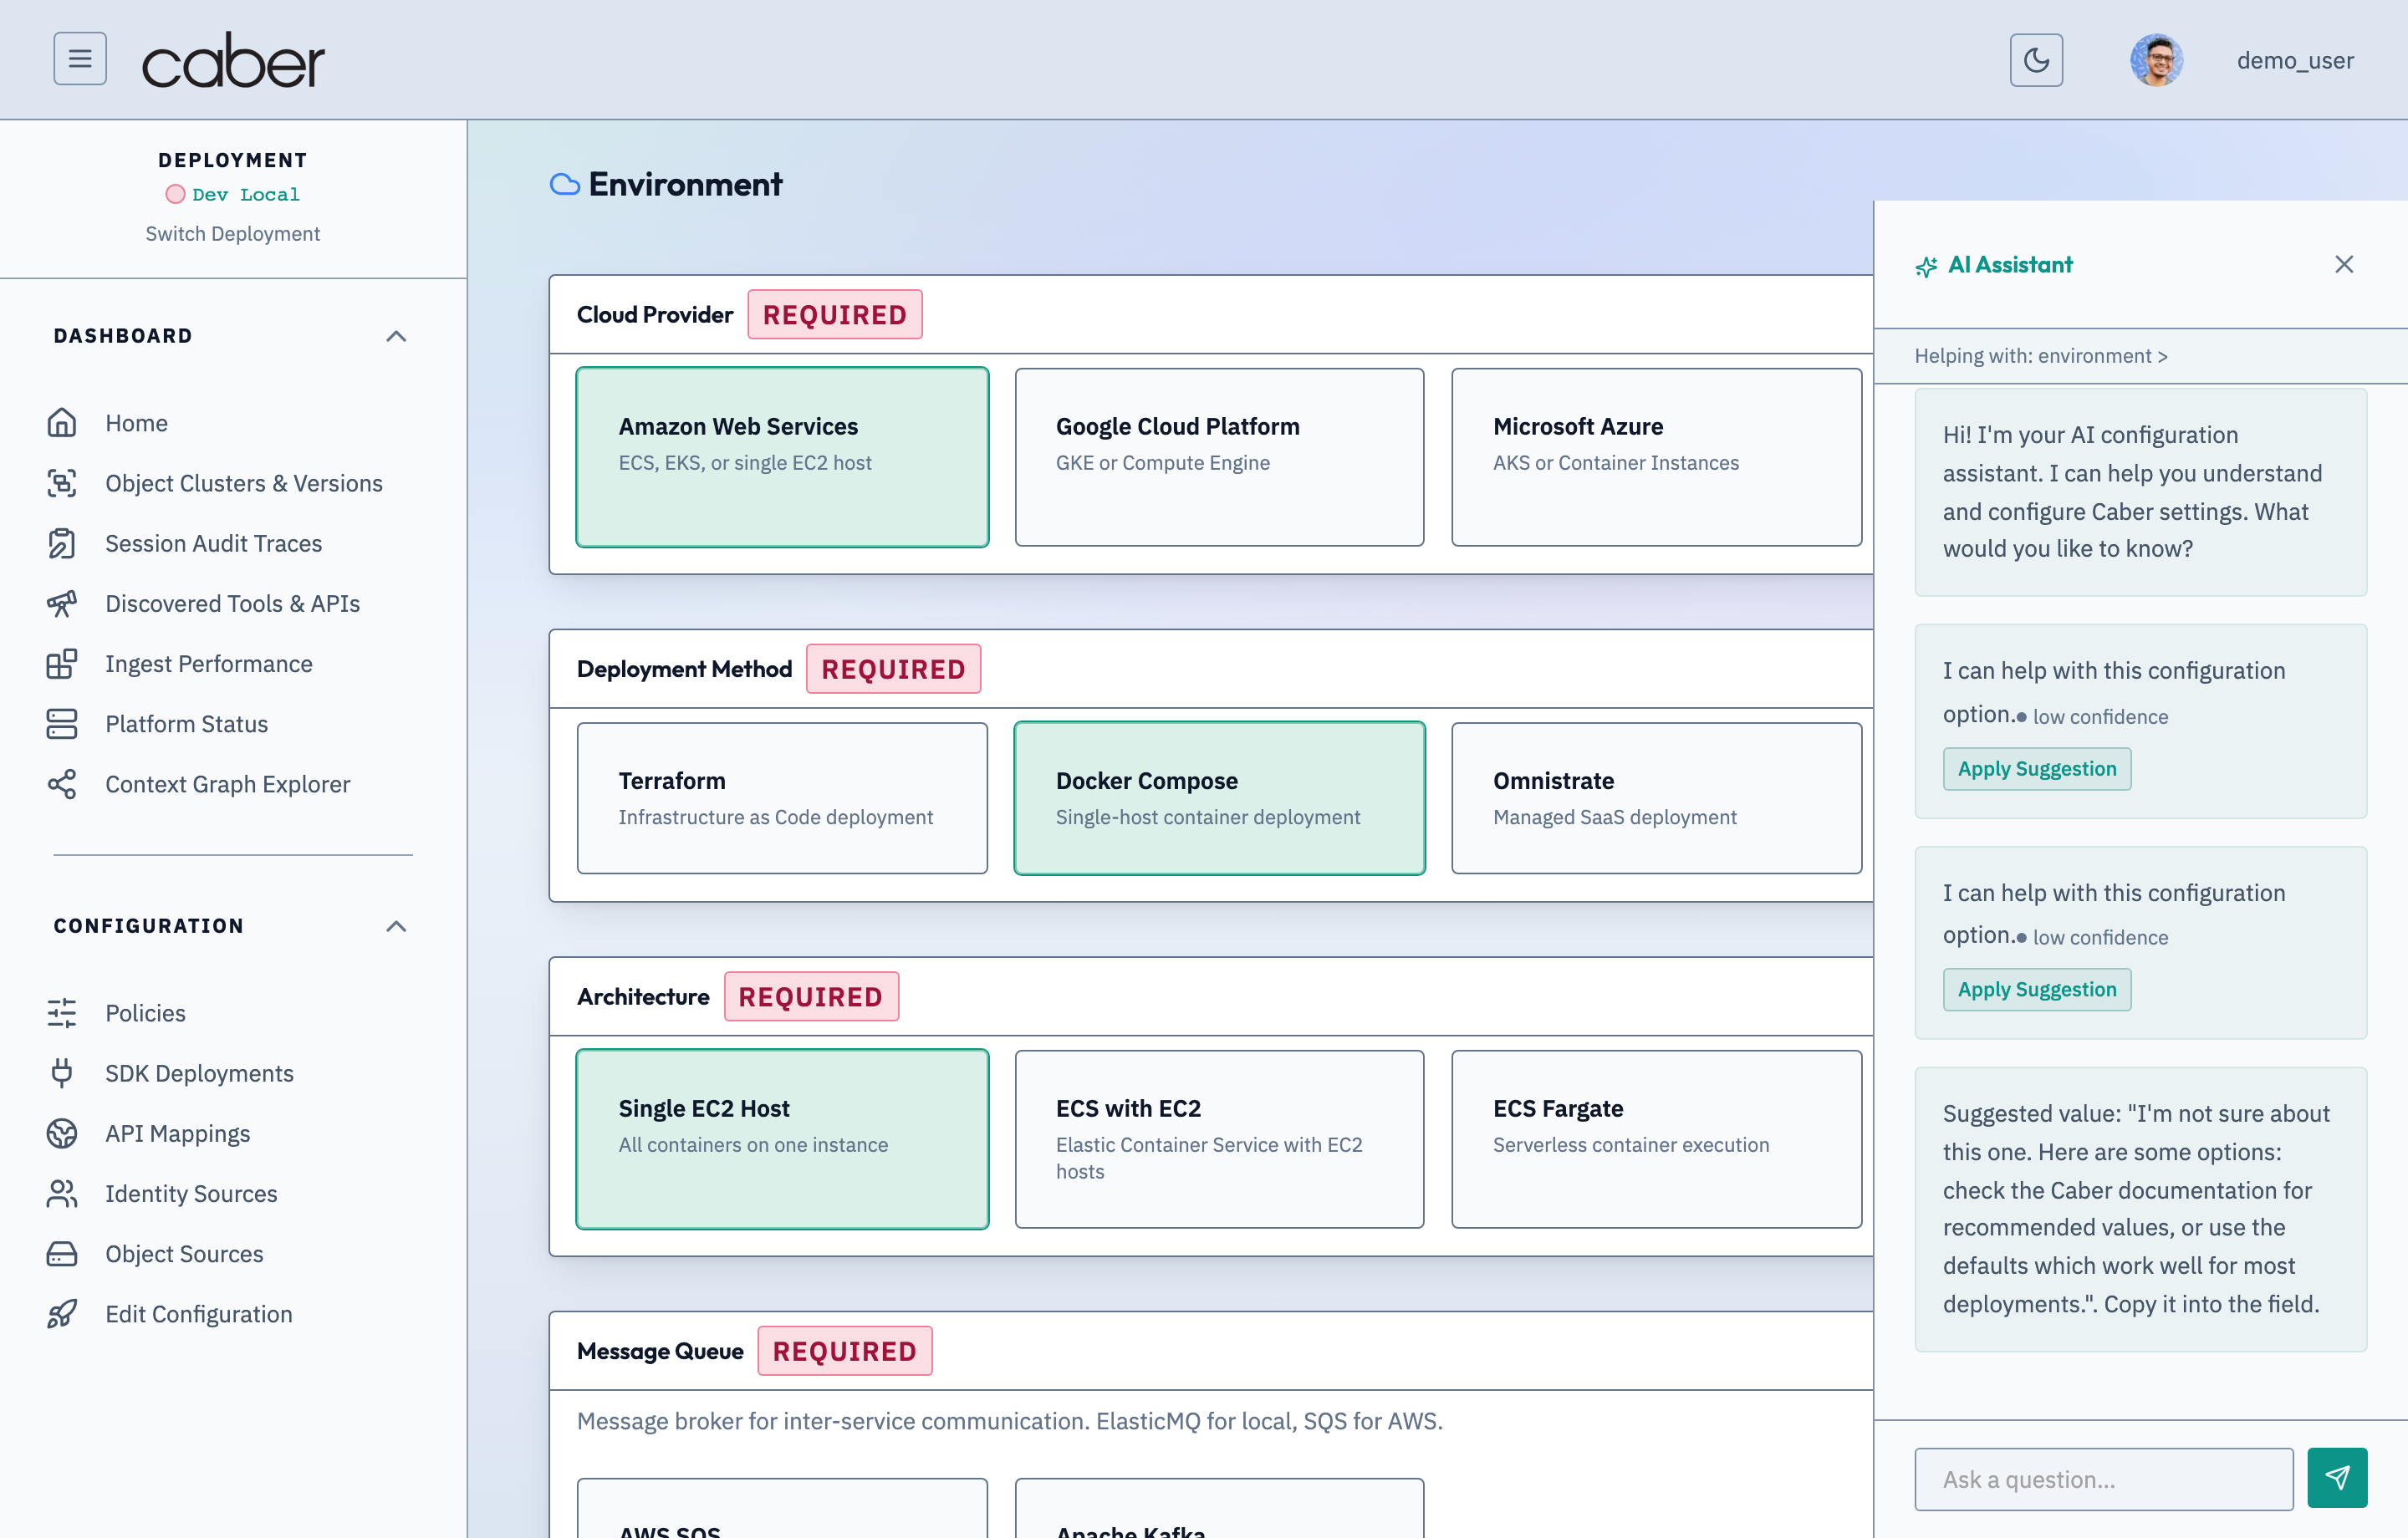
The assistant loads field documentation and best practices from the configuration knowledge base (getFieldHelp / getSectionHelp) and connects to askConfigAssistant for interactive troubleshooting:
- Contextual Explanations and Best Practices: Opening the drawer immediately displays the target section's operational summary, recommended best practices, and example values (such as
GLOBAL.LOG_LEVELorGLOBAL.CABER_ADMIN_API_KEY). - Confidence Rated AI Suggestions: When an operator asks how to configure a parameter or clicks
Apply Suggestion, the drawer displays recommended values with a color coded confidence indicator (highemerald dot,mediumamber dot, orlowrose dot) and copies the suggested value directly to the operator's clipboard for immediate pasting. - Interactive Follow Up Questions: Operators can type freeform questions in the
Ask a question about this setting...input (Enterto send) to receive multi turn guidance onApiMaproute rules,OBOtoken minting, or Rego policy priority bands while keeping their configuration form open on the left.