
Dashboards, Observability & Context Graph
The Dashboards and Explore sections of the Caber User Console provide real time operational visibility into corpus governance coverage, document version lineage, characterization throughput, platform health, and ontological graph relationships. Every dashboard synchronizes with the connected deployment and updates its charts, Cytoscape canvases, and telemetry tables across both dark obsidian and high contrast light modes.
Home Overview Dashboard (/admin/home)
The Home Overview page (/admin/home) serves as the primary operational landing screen after connecting to a deployment. It combines corpus level snippet coverage with live enforcement telemetry and expandable infrastructure operations cards.
/admin/homeExecutive Overview & Four Core Governance Questions DashboardAssertion Verified: Proves that the Executive Overview dashboard synthesizes all four governance questions—data duplication, runtime policy verdicts, AI provenance traces, and platform health—into a single real-time operational command center.
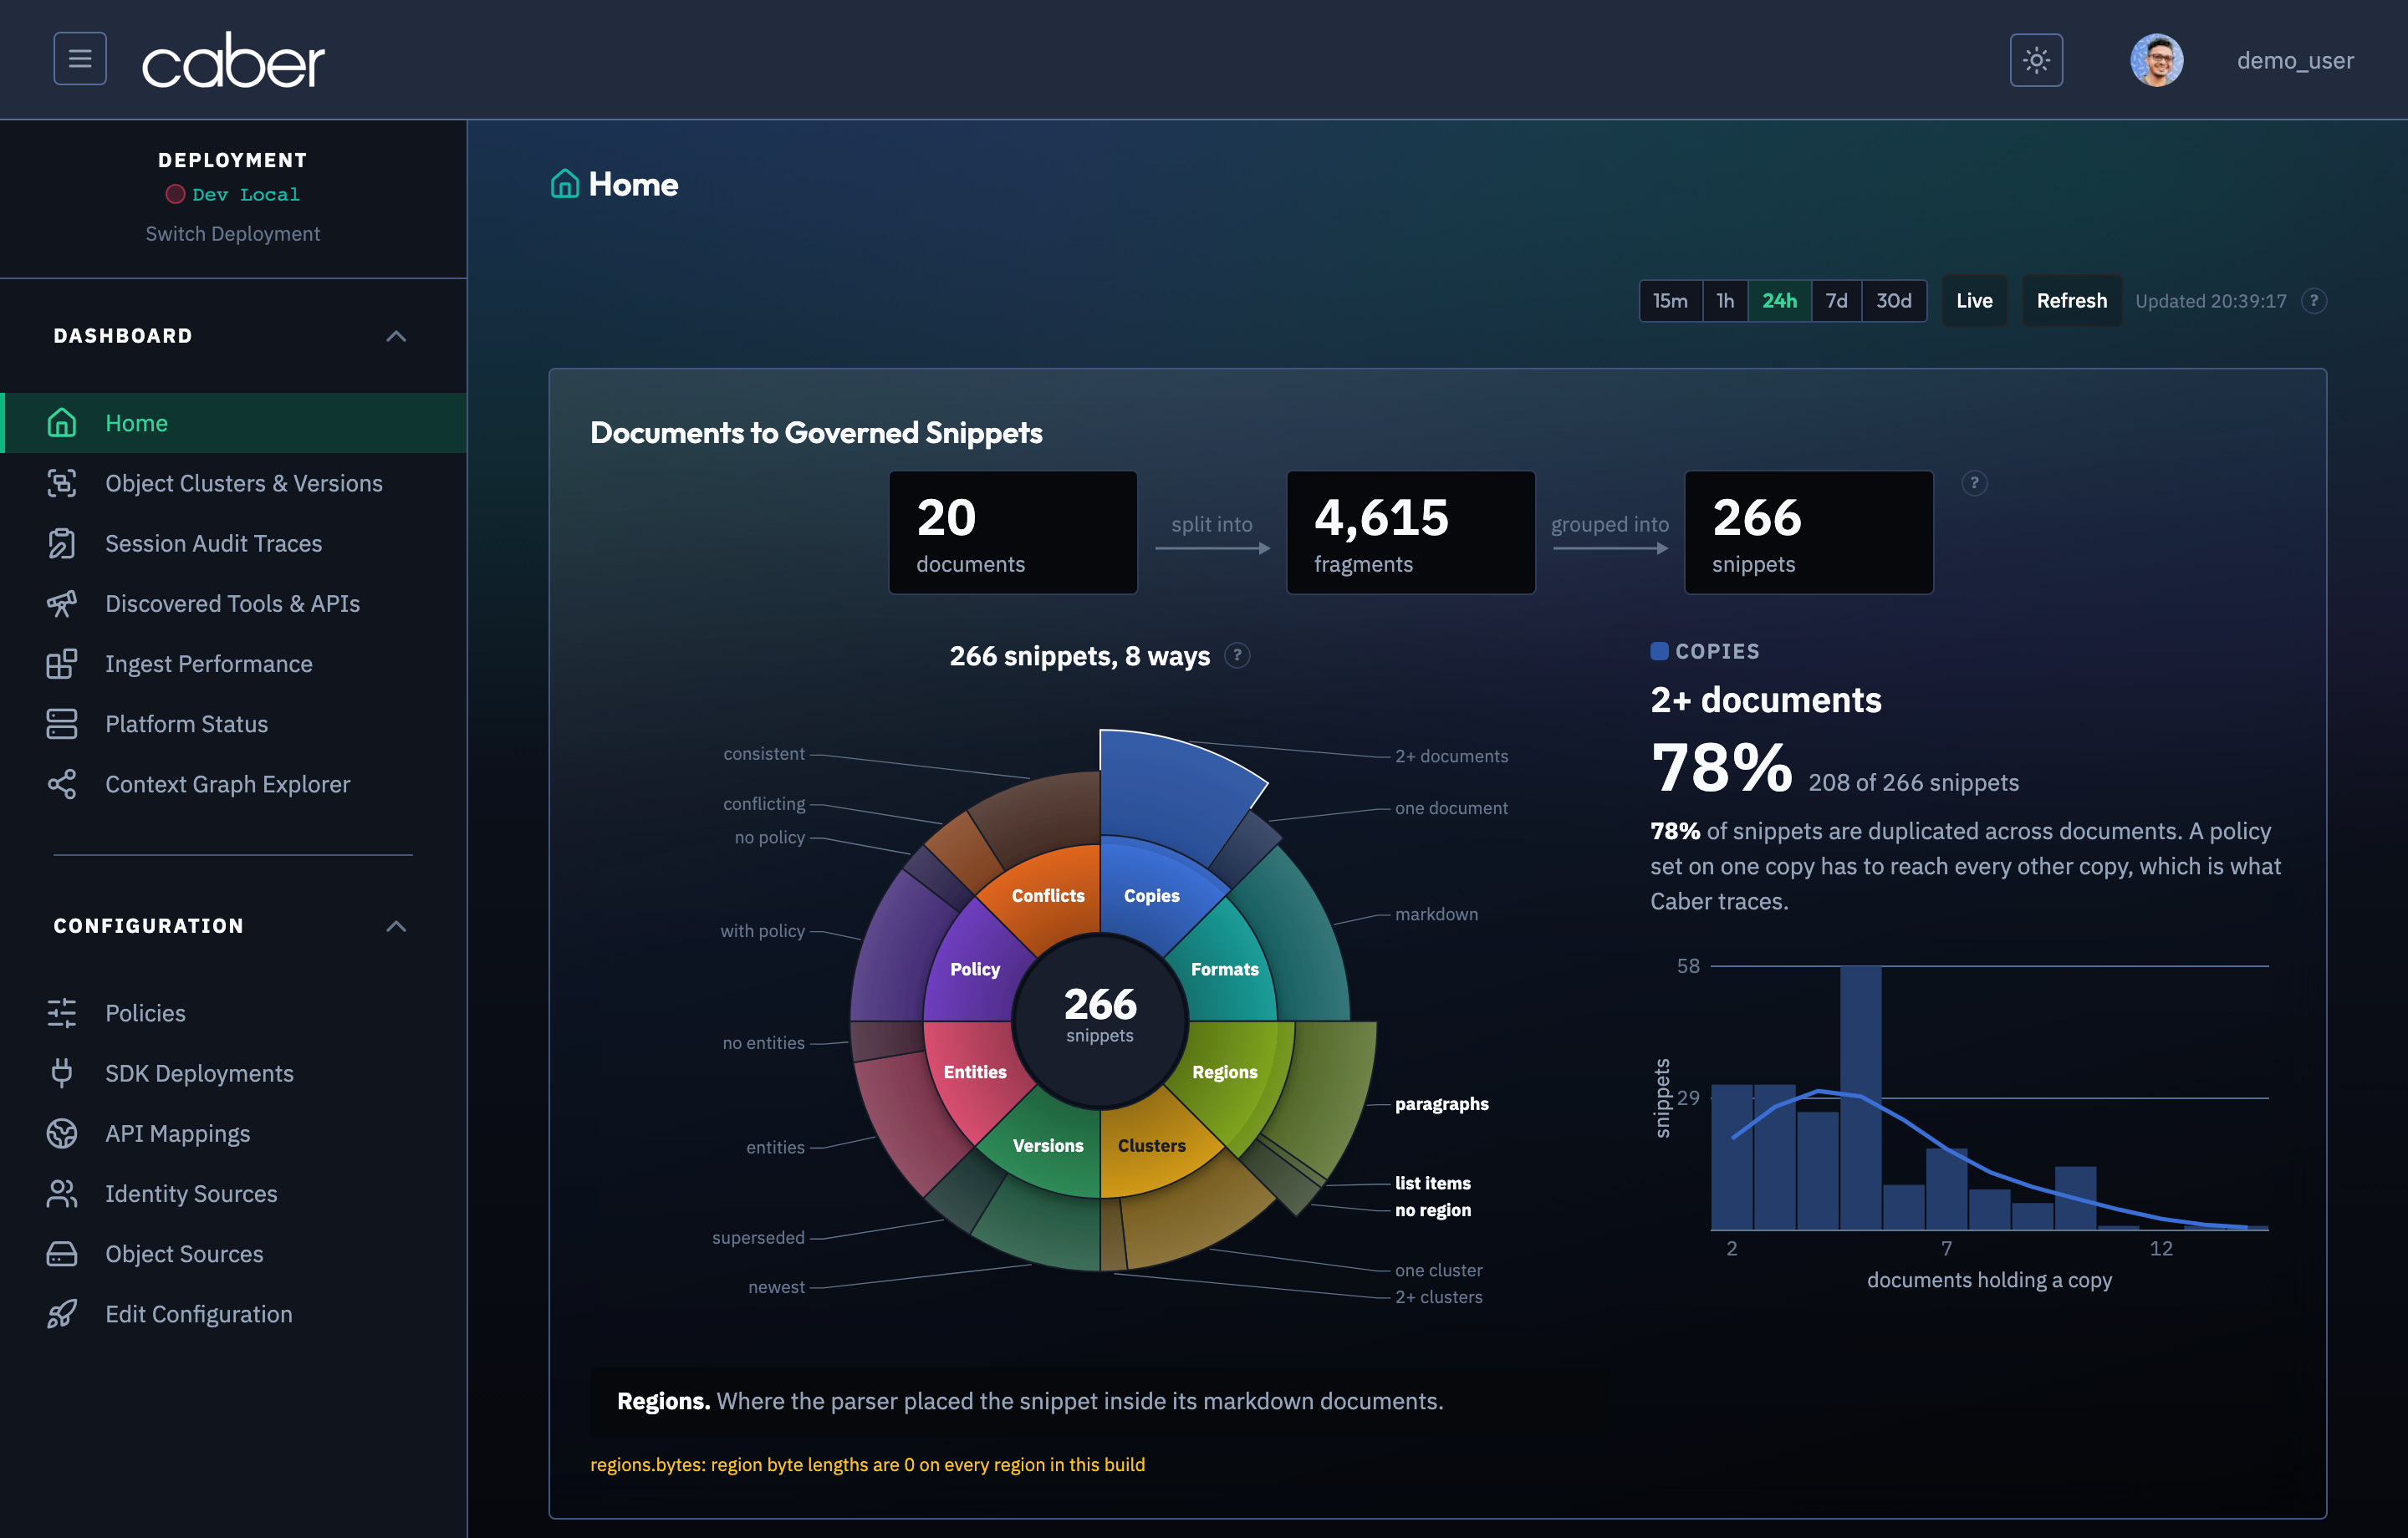
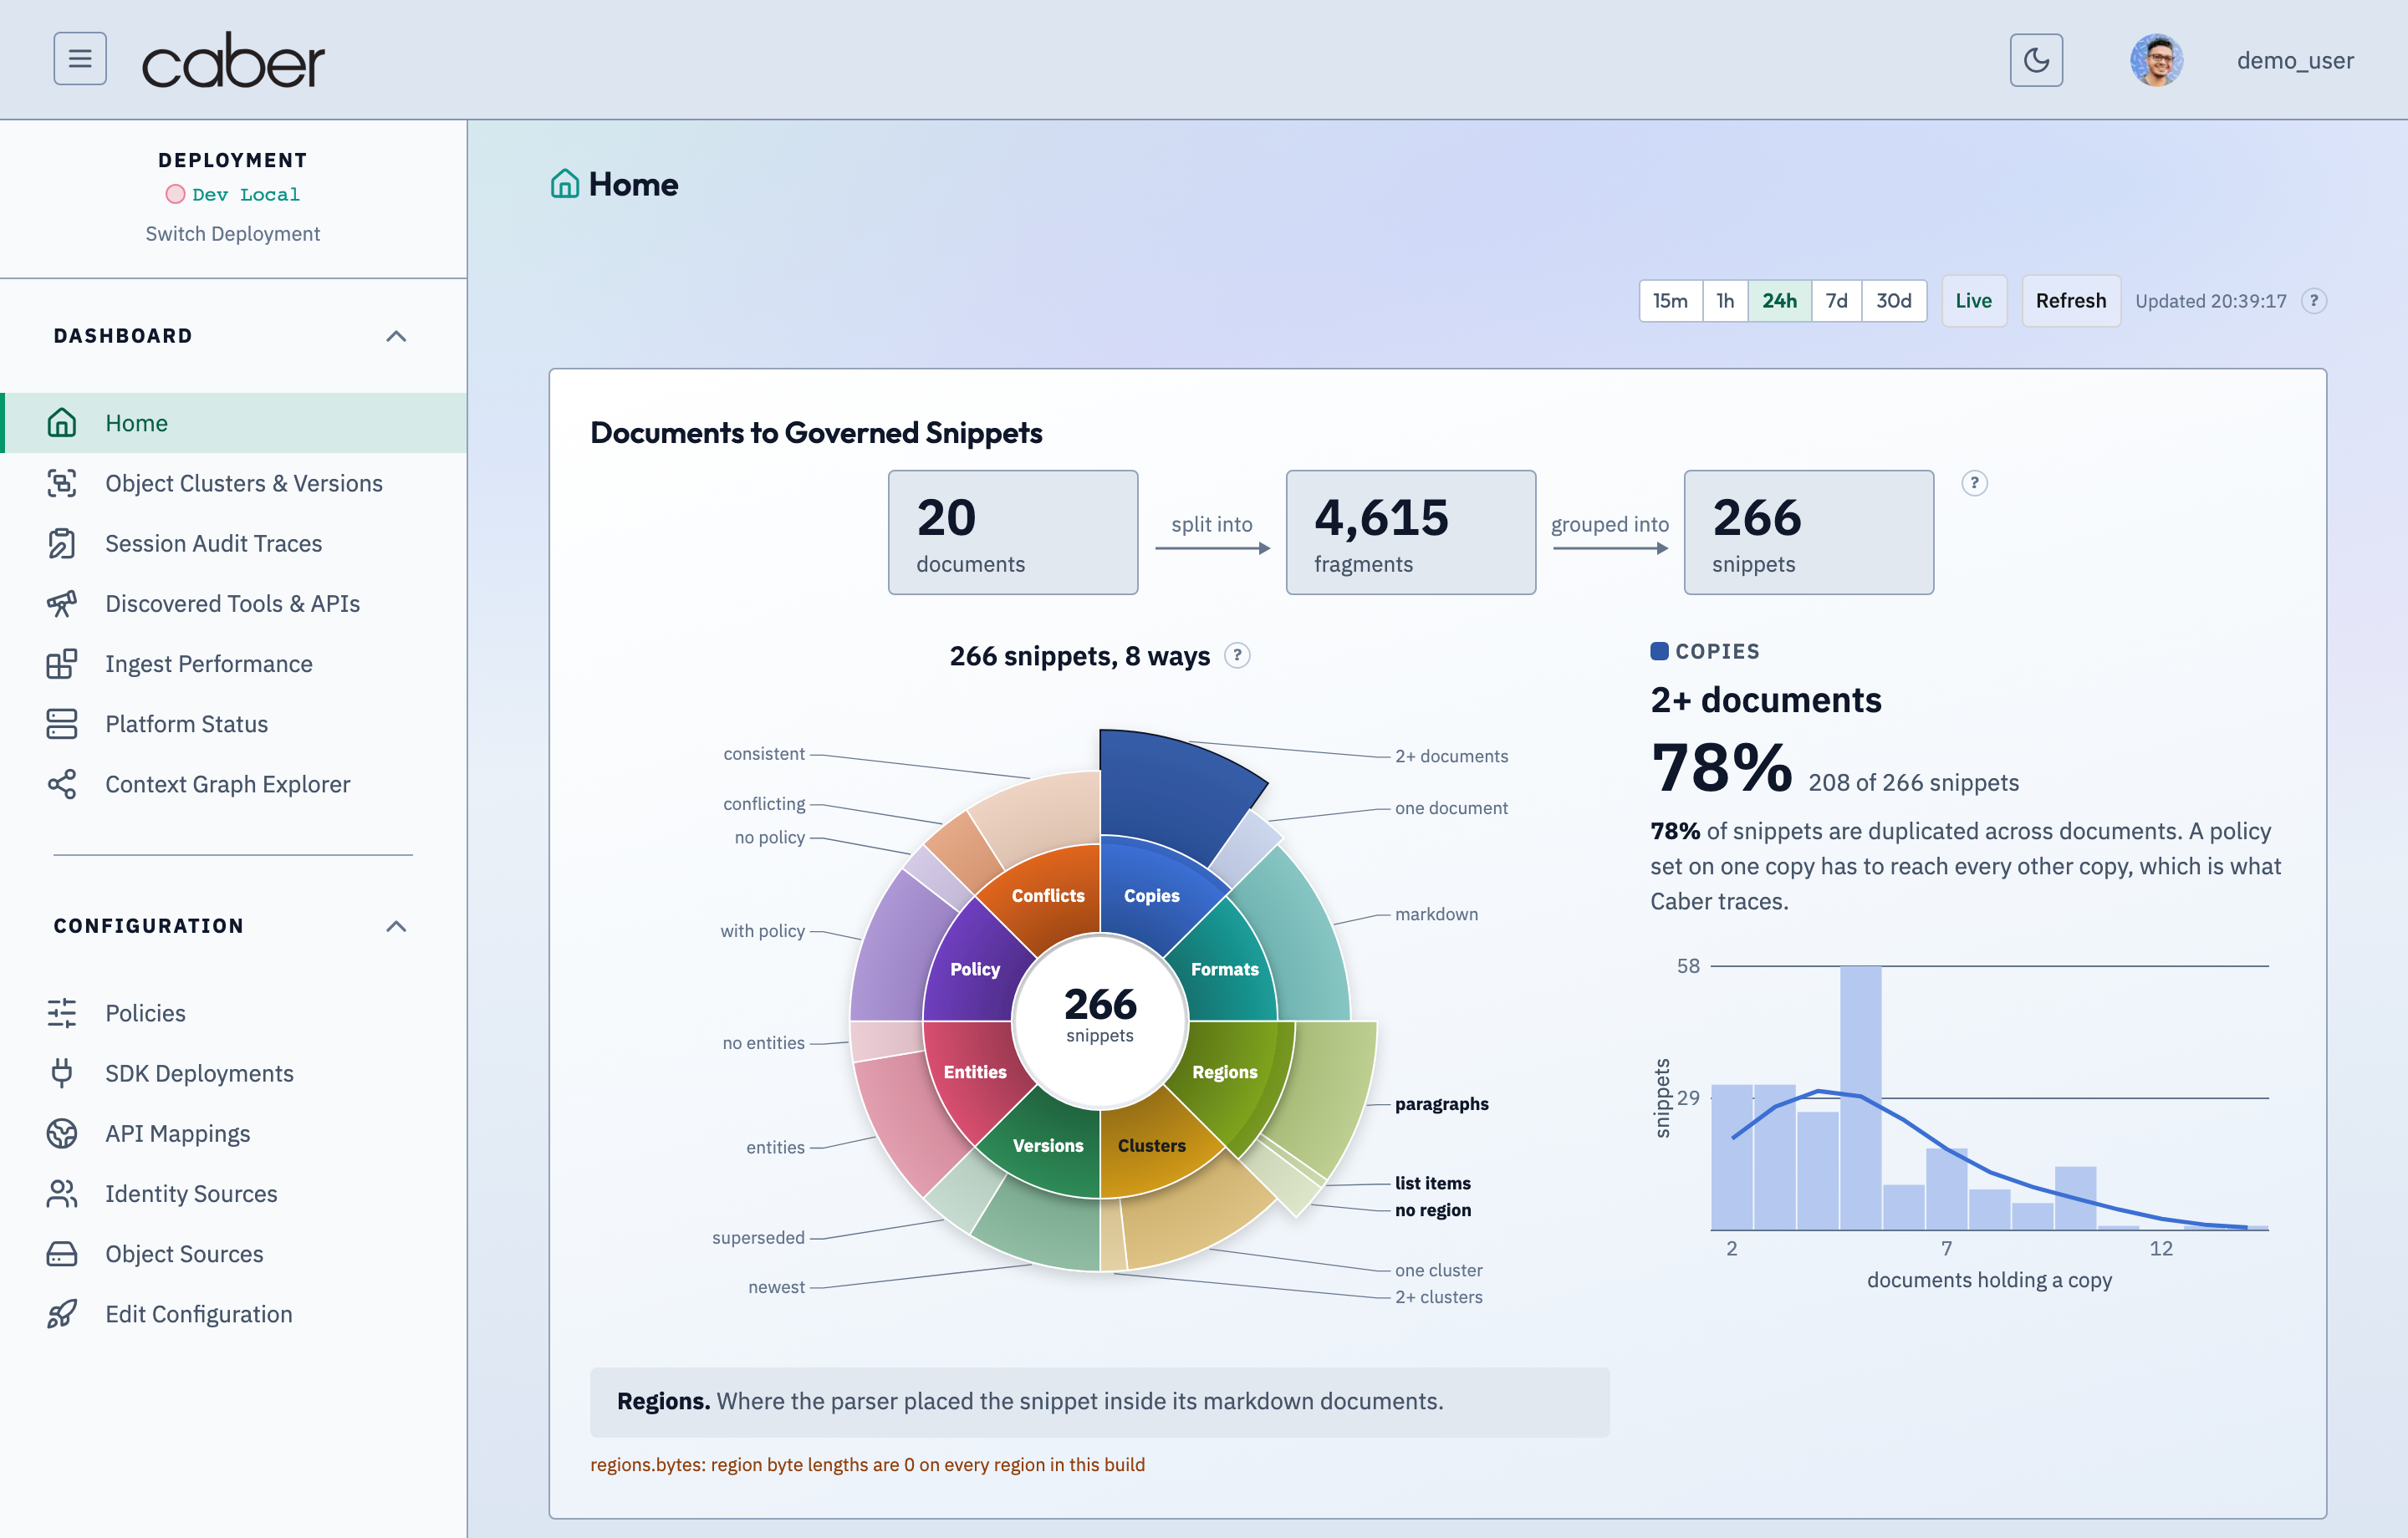
Corpus Snippet Hero and Interactive Policy Sunburst
The top region of /admin/home renders the Snippet Coverage Hero (SnippetHero) alongside the two ring Policy Sunburst (PolicySunburst):
- Corpus Snippet Hero Metrics: Displays total characterized documents, total indexed subsentence snippets (
LNKDequivalence classes), active policy boundary coverage, and fresh versus stale version counts fetched from the home snippets telemetry endpoint. - Two Ring Policy Sunburst:
- Inner Ring (Repository Sources): Segments the corpus by storage source (such as
minio-contracts,mna-dataroom, orsec-edgar-archive). - Outer Ring (Governance Policy Coverage): Subdivides each source by the active governance policy or sensitivity classification protecting its regions.
- Interactive Slice Selection: Hovering or clicking any slice highlights the corresponding repository or policy breakdown in the adjacent legend and filters the summary metrics to that segment.
- Inner Ring (Repository Sources): Segments the corpus by storage source (such as
- Four Core Telemetry Panels: Immediately below the hero, a four column summary grid surfaces:
- Enforcement Verdicts (
/api/audit-v2/verdicts): Breakdown ofALLOW,REDACT, andBLOCKdispositions over the active time window (15m,1h,24h,7d,30d). - Proxy & Enforcement Latency (
/api/perf/latency):p50,p95, andp99stream inspection and policy evaluation latencies in milliseconds. - On Behalf Of (
OBO) Principal Activity (/api/audit-v2/obo/summary): Count of delegated agent invocations wherepycaberminted or validated a narrowedOBOtoken. - Top Policy Hits (
/api/audit-v2/policies/hits): Ranked list of authored and system policies triggered during agent retrieval and inference.
- Enforcement Verdicts (
Expandable Operations and Flagged Activity Cards
At the bottom of /admin/home, operators can click the Operations & Activity Details toggle (data-testid="home-operations-toggle") to reveal the secondary operational deck without leaving the home screen.
/admin/homeExecutive Overview with Expanded Operations & Pipeline TelemetryAssertion Verified: Proves that operators can expand the inline Operations telemetry drawer on /admin/home to inspect real-time ingestion throughput, queue backlog, and subsystem health without leaving the executive dashboard.
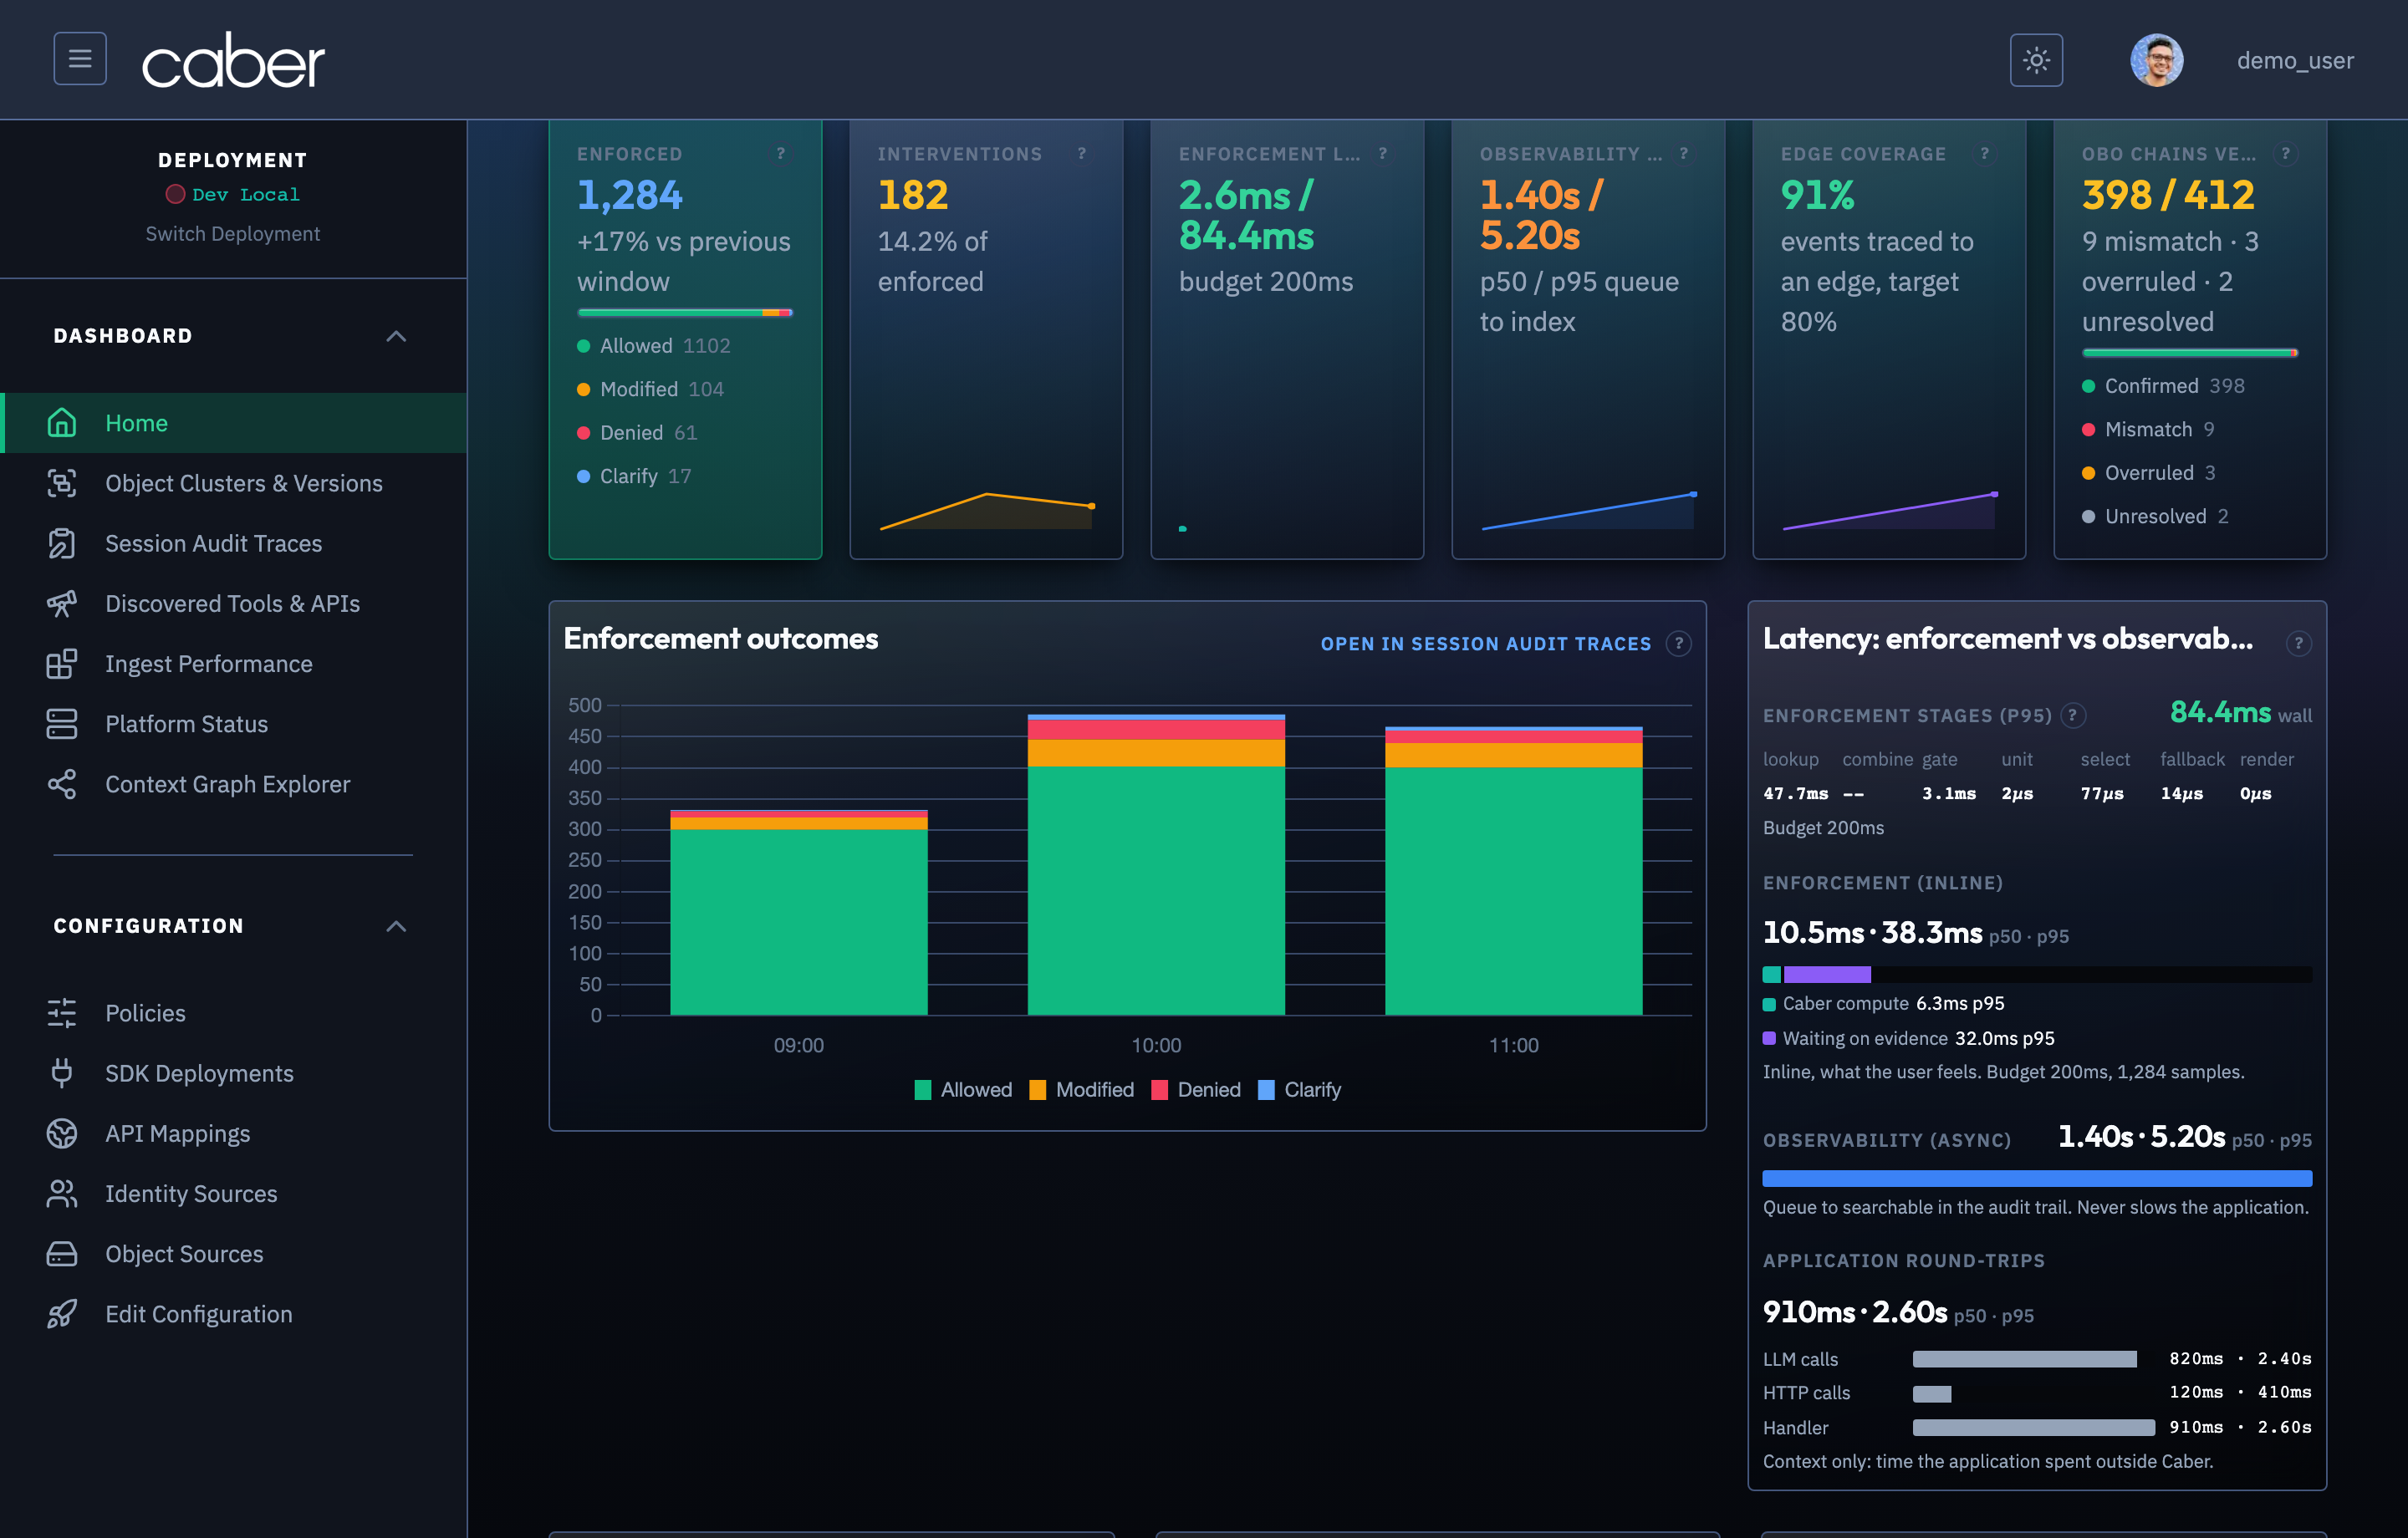
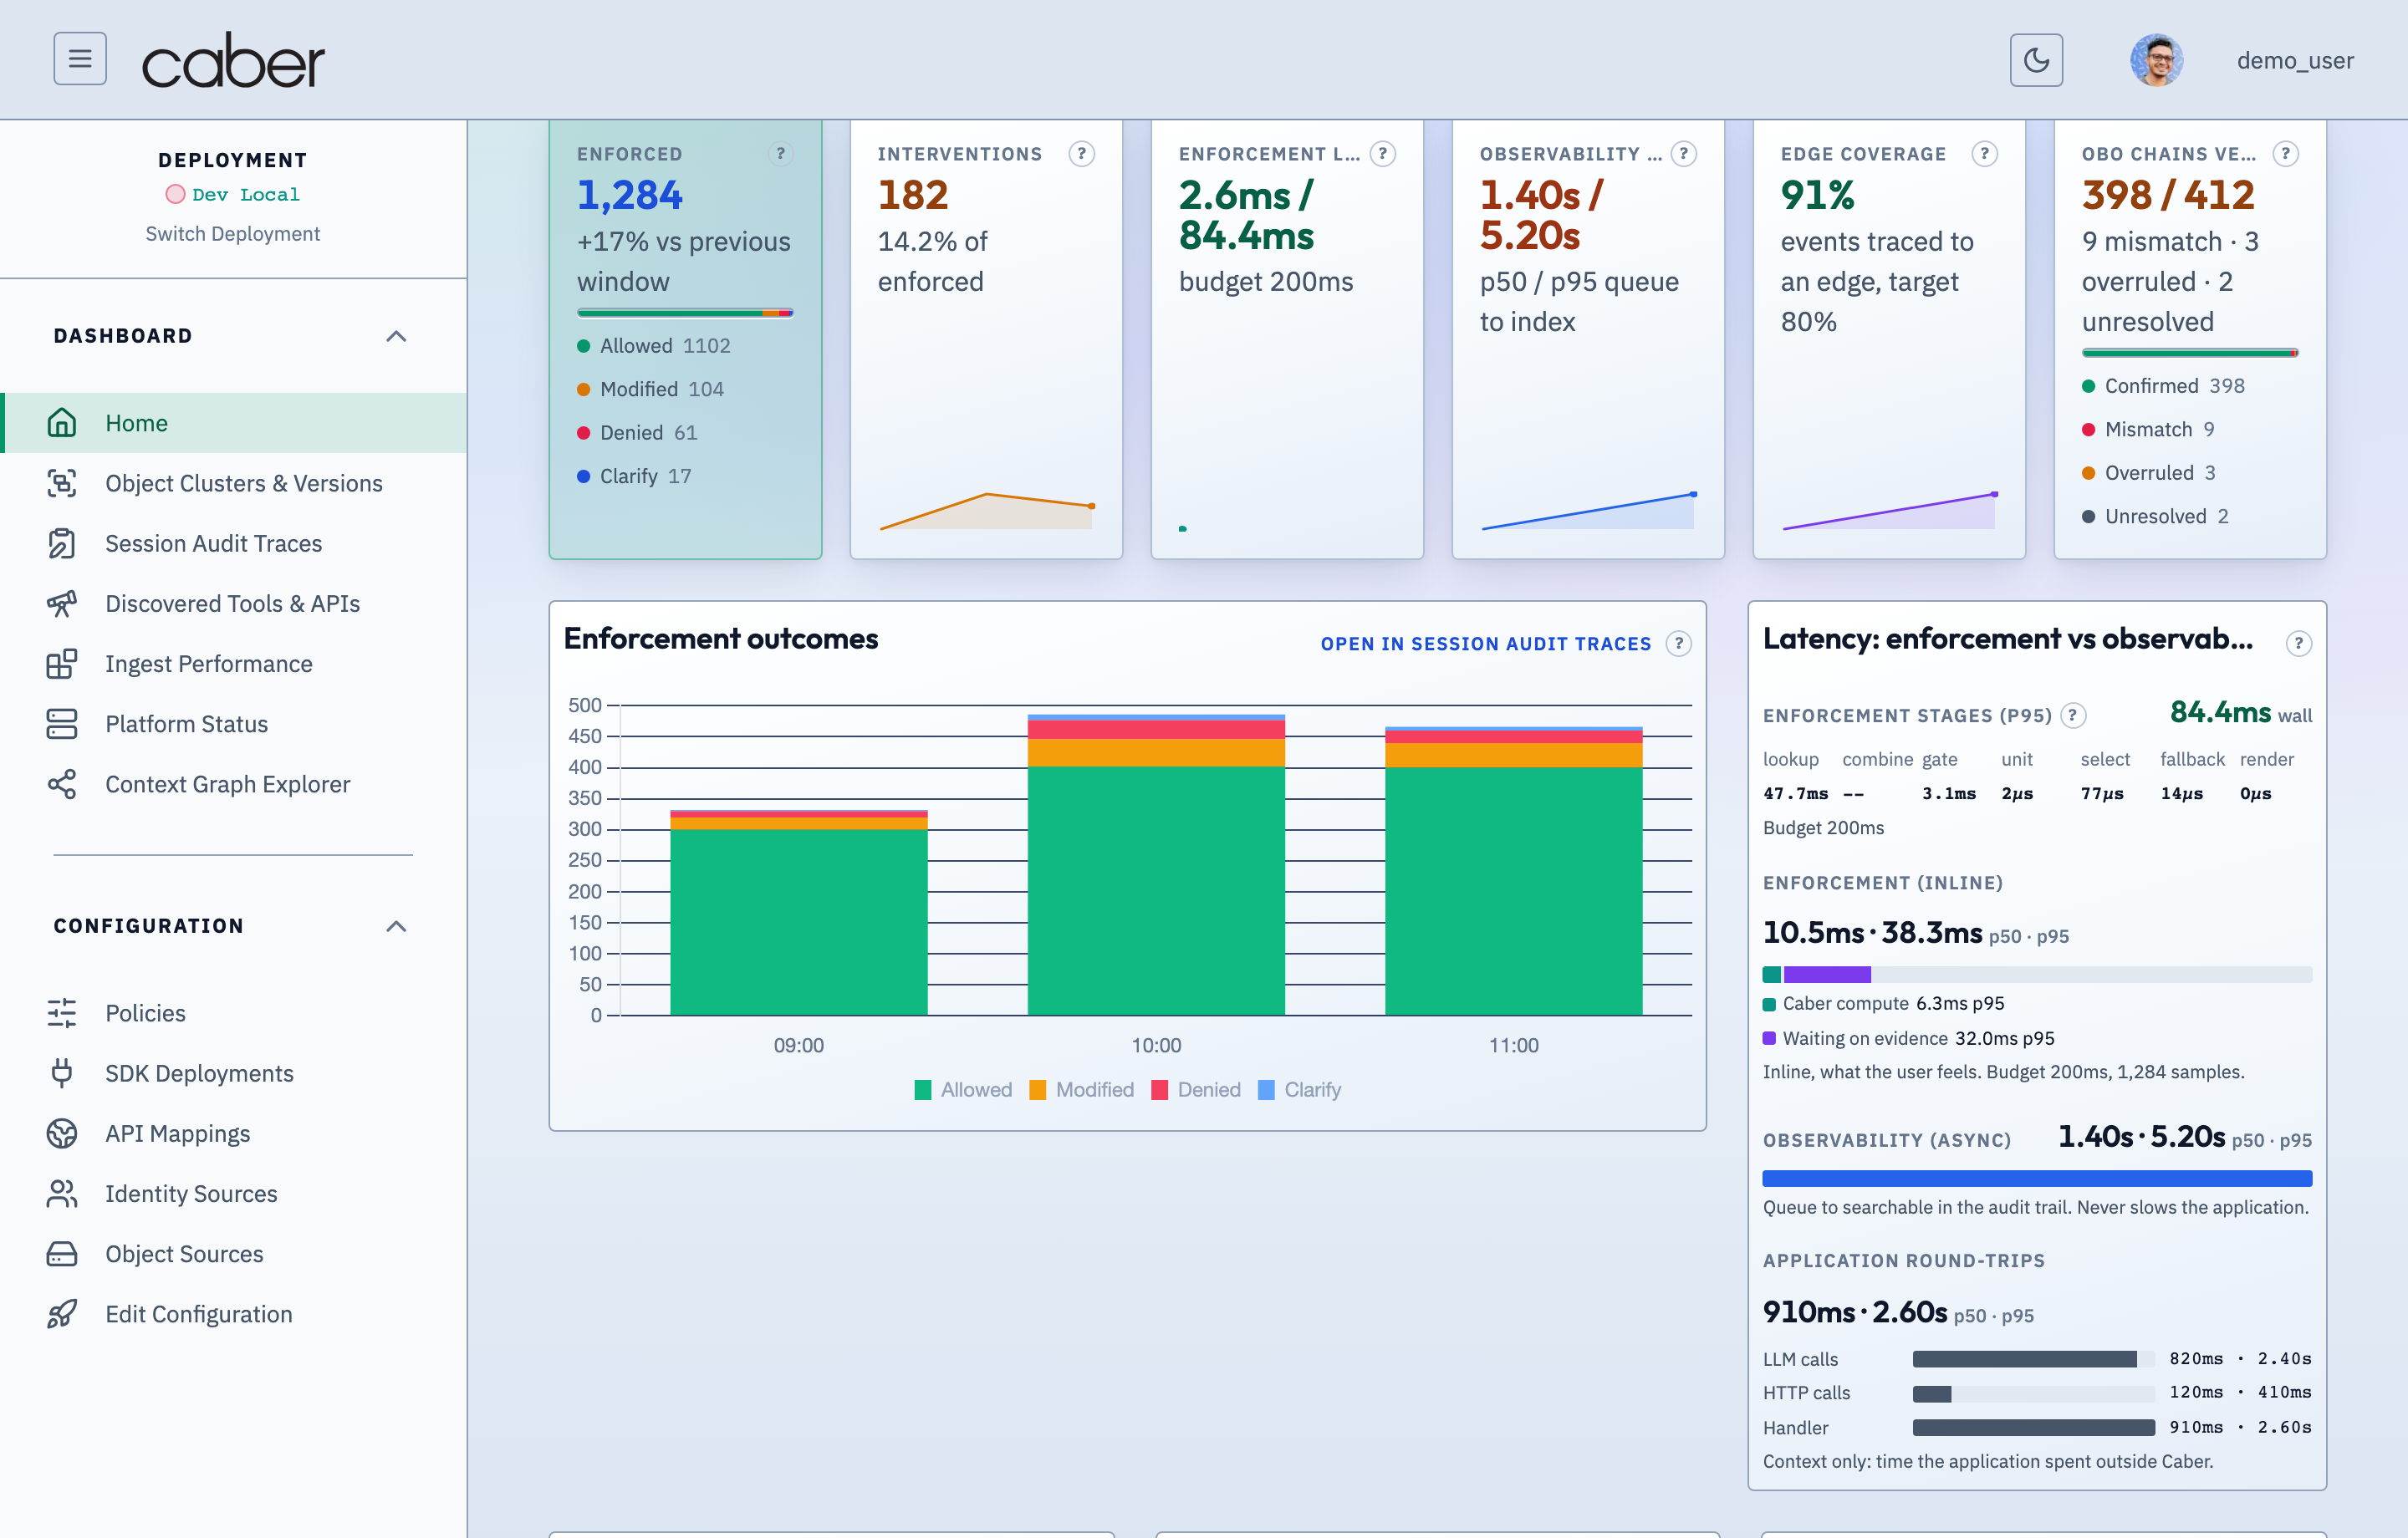
Expanding this drawer reveals three live operational cards:
- Deployment Health Matrix (
/api/deployment-health): Shows real time reachability and response latency forcaber_core, OpenSearch (csi_audit_v3,csi_api_map,csi_obj_versions), Neo4j, and configured object stores. - Recent Flagged Traces (
/api/audit-v2/flagged): Lists the most recent traces containing surgical redactions (R) or policy blocks, with one click drill down links that open/admin/auditdirectly on the flaggedtraceId. - Connector & Source Activity (
/api/connectors/activity): Summarizes recent object ingest events, identity synchronization runs, and active SDK service heartbeats.
Object Clusters and Version Lineage (/admin/overlapping)
The Object Clusters & Versions page (/admin/overlapping) visualizes how subsentence content (RKCQF / LNKD shingles) flows across document revisions, copies, and repositories. It exposes the two core failure modes of ungoverned retrieval: stale version leakage (where an agent retrieves a superseded draft) and cross boundary policy drift (where shared clauses appear inside documents governed by conflicting access policies).
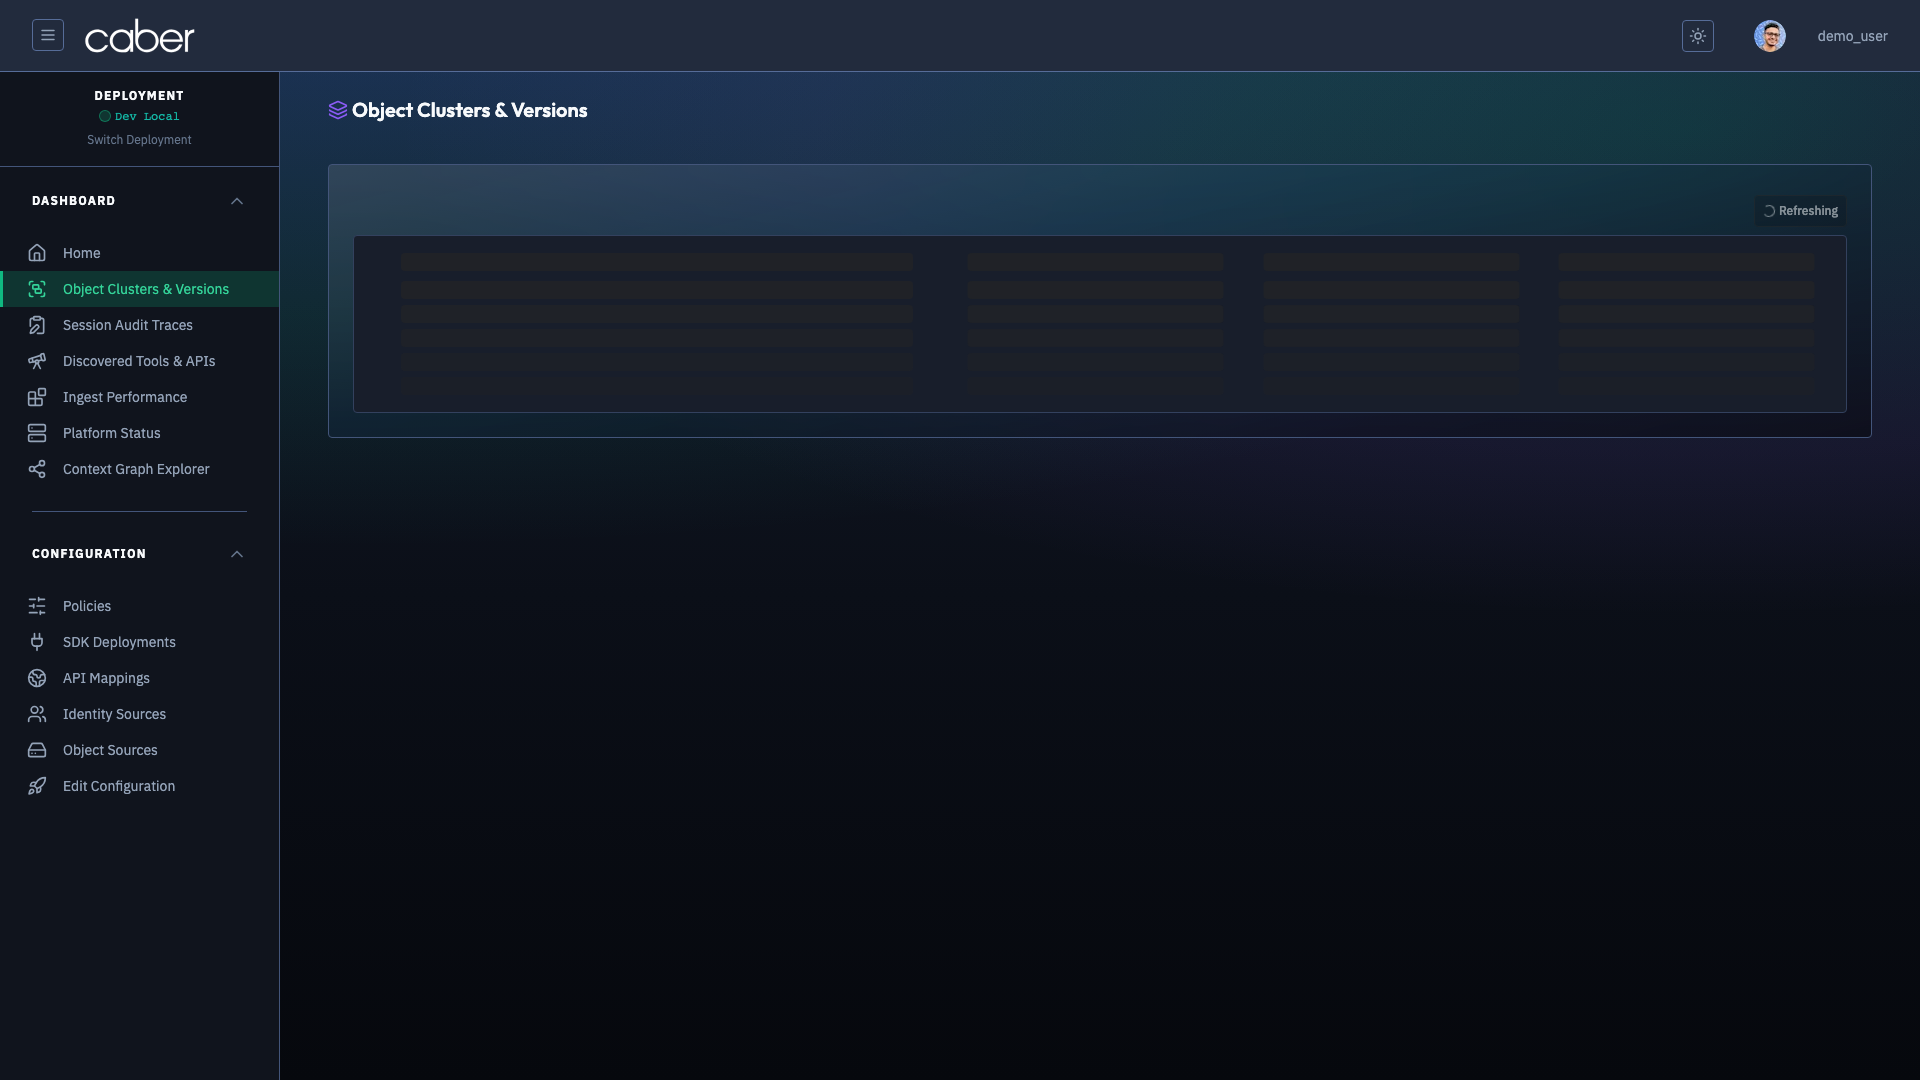
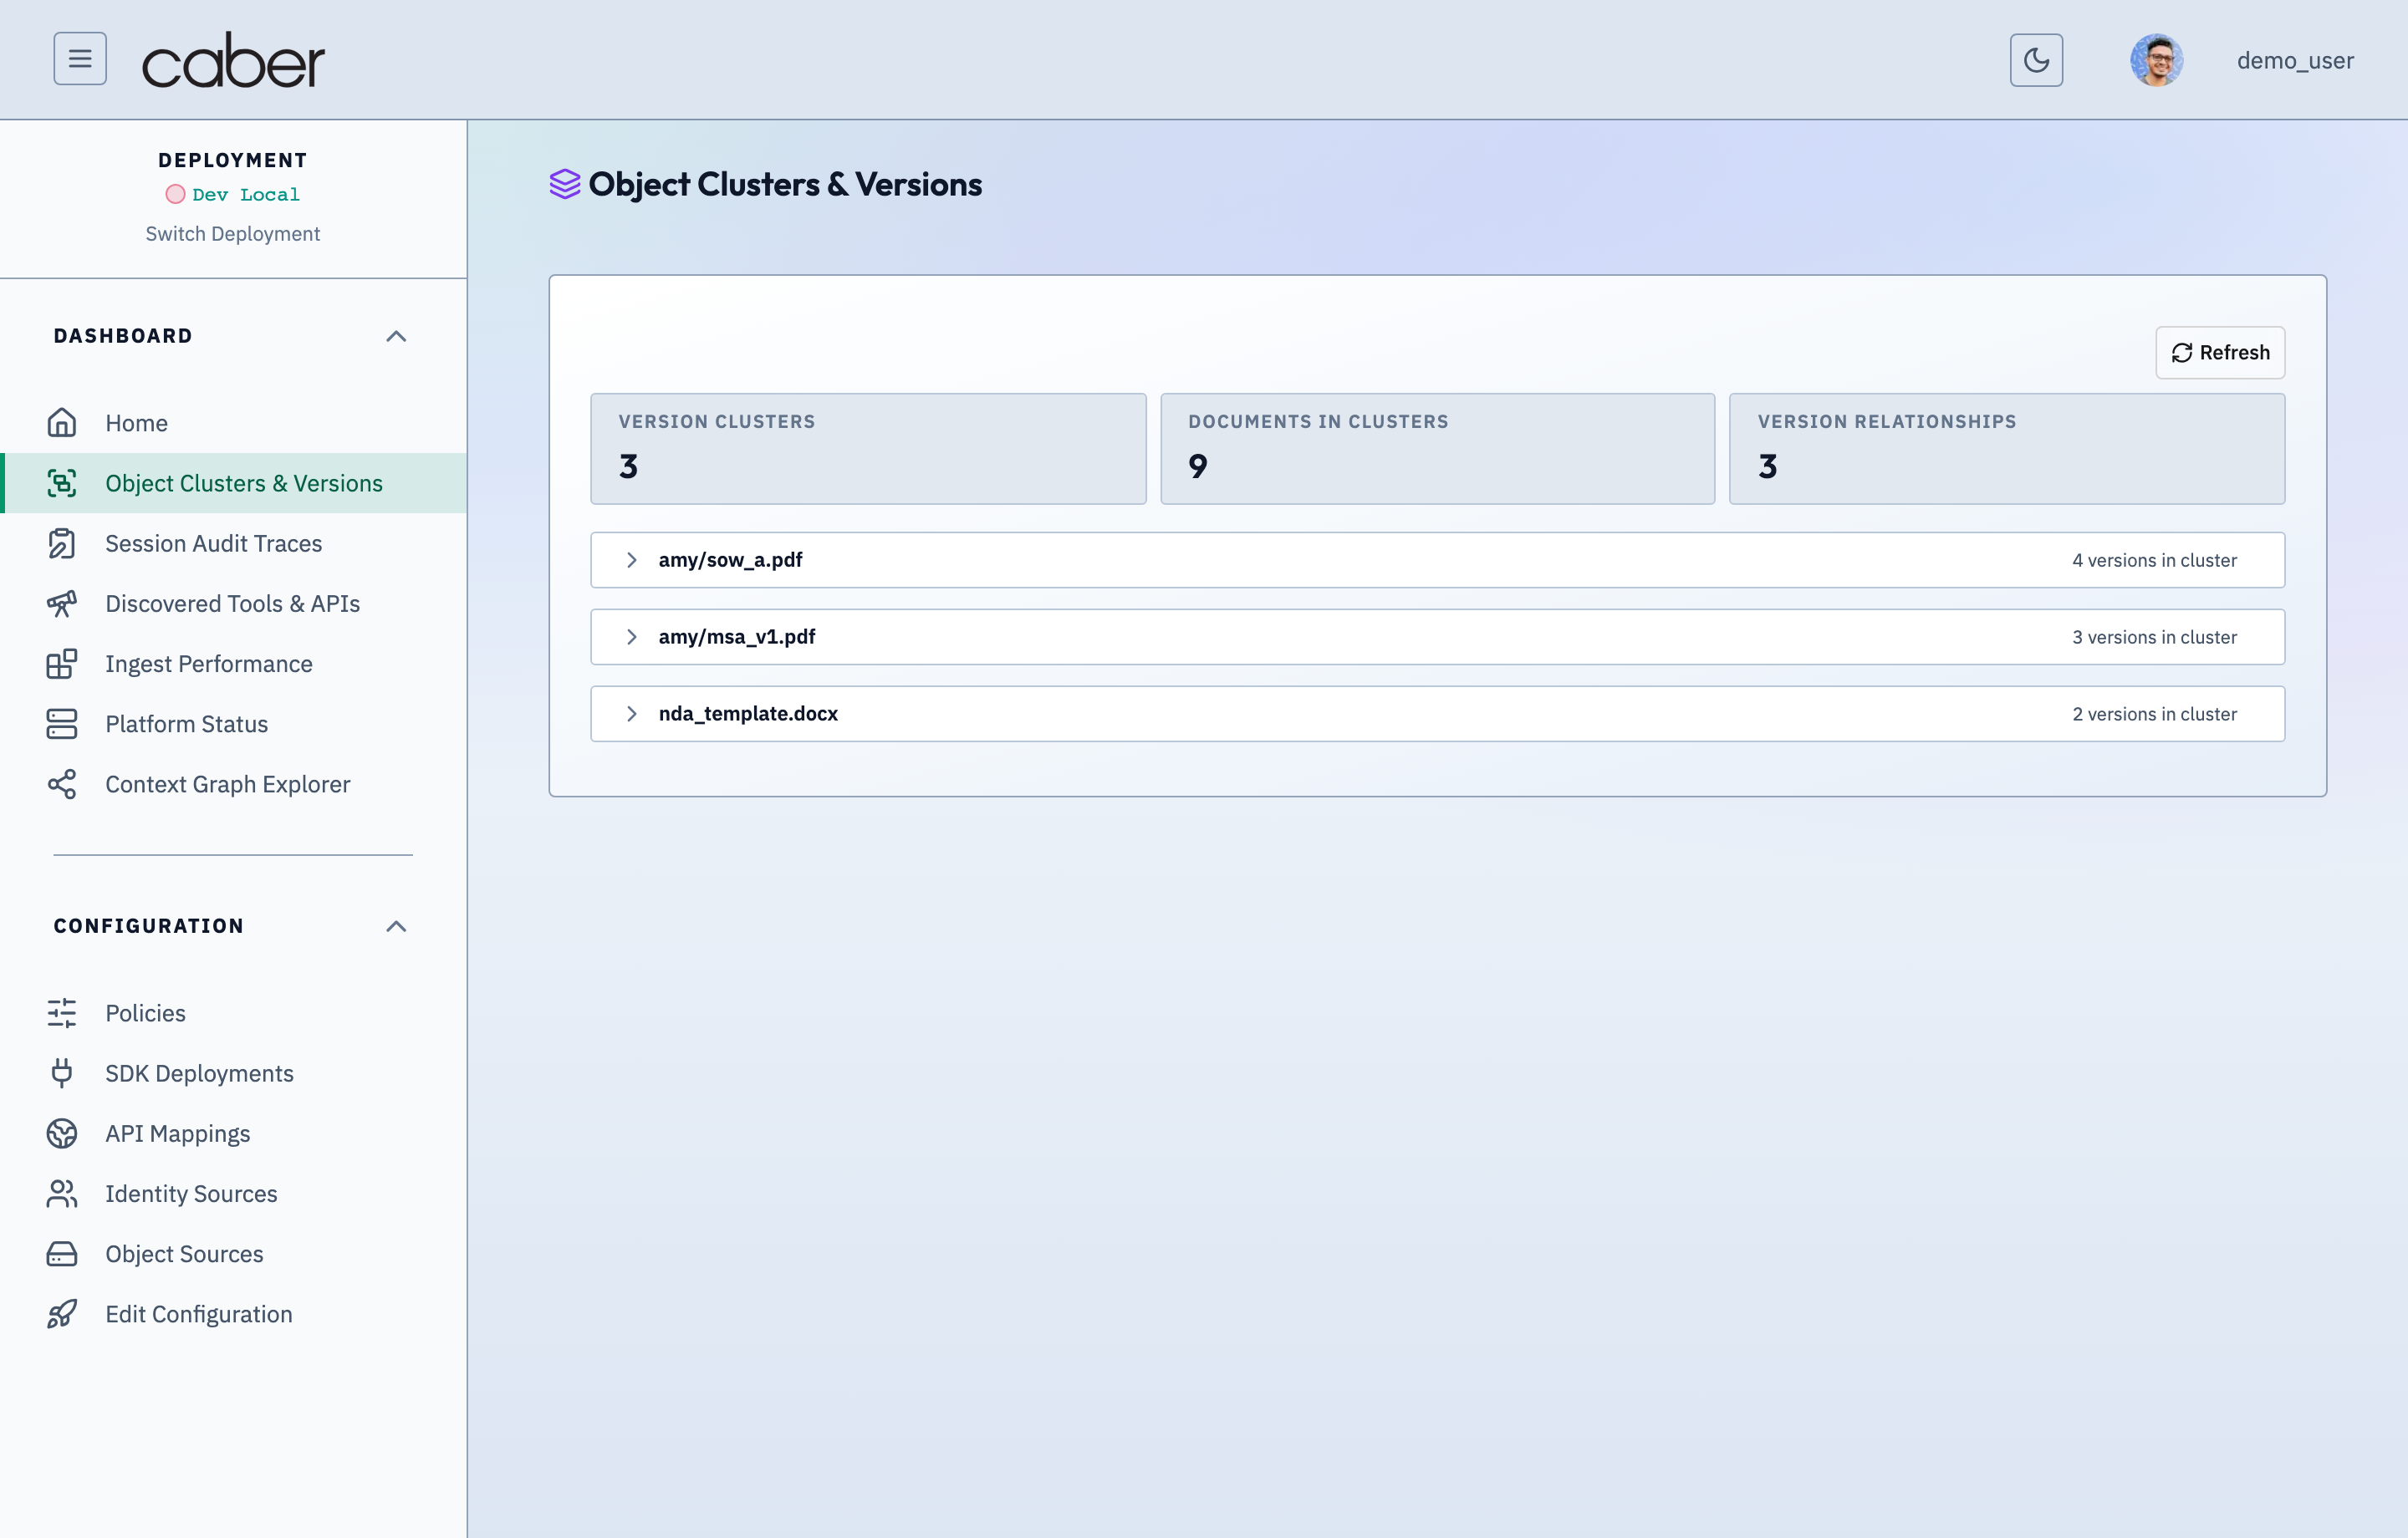
/admin/overlappingDuplicate Data Tracker & Side-by-Side Freshness Cluster InspectorAssertion Verified: Proves that Caber detects 85% to 99% enterprise content duplication down to 40-byte WRL sub-sentence phrases (97% to 98.7% coverage), separates canonical fresh sources (version_sequence == 0) from stale replicas, and enforces origin trade-secret policies even when text is copied into unlabeled channels.
Version Cluster Summary and Lineage Cards
At the top of /admin/overlapping, three KPI counters summarize the corpus lineage state returned by /api/overlap-compare/list:
- Version Clusters: Total connected document lineages resolved by Inverse Document Frequency (
IDF) content containment analysis (csi_obj_versions). - Documents in Clusters: Total document versions participating across all multi version lineages.
- Version Relationships: Total directed parent to child derivation edges across the resolved directed acyclic graphs (
DAGs).
When an operator navigates to /admin/overlapping by clicking a provenance badge inside /admin/audit, a blue telemetry banner (data-testid="overlap-selection-banner") appears at the top of the page listing the exact sources Caber used in that trace and automatically expands the matching cluster.
Expanded Cluster Timeline DAG and Policy Boundary Hulls
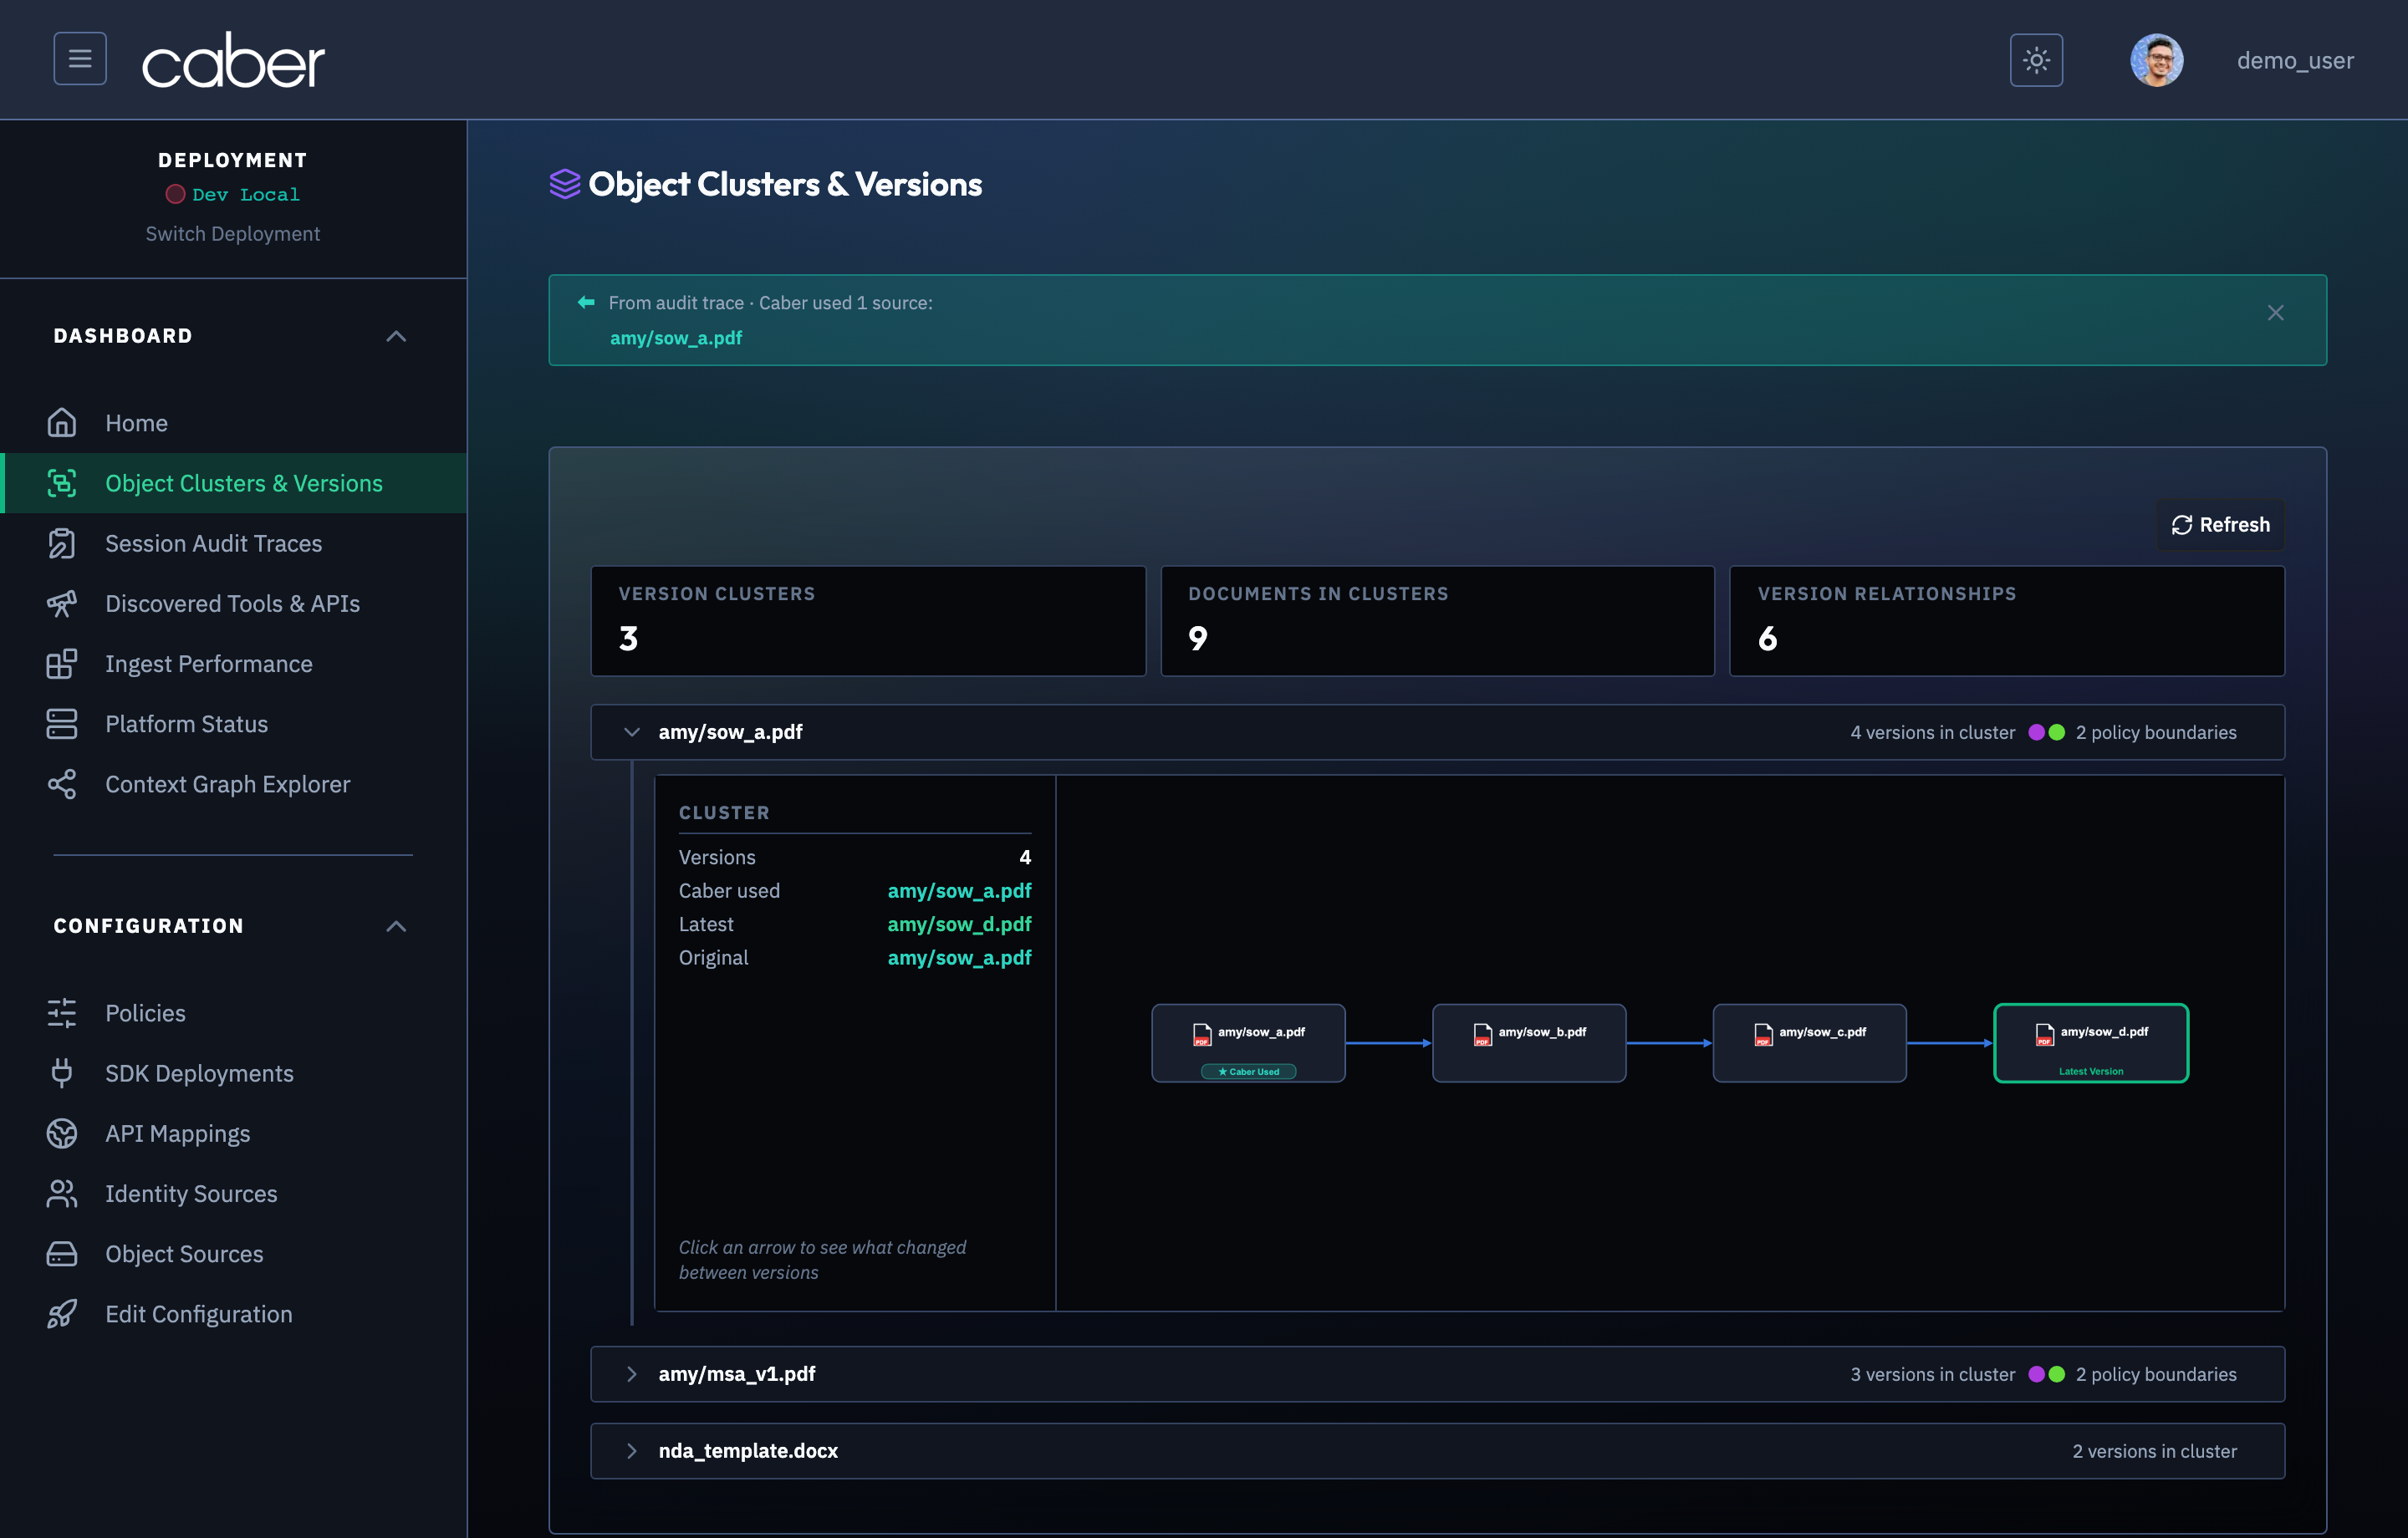
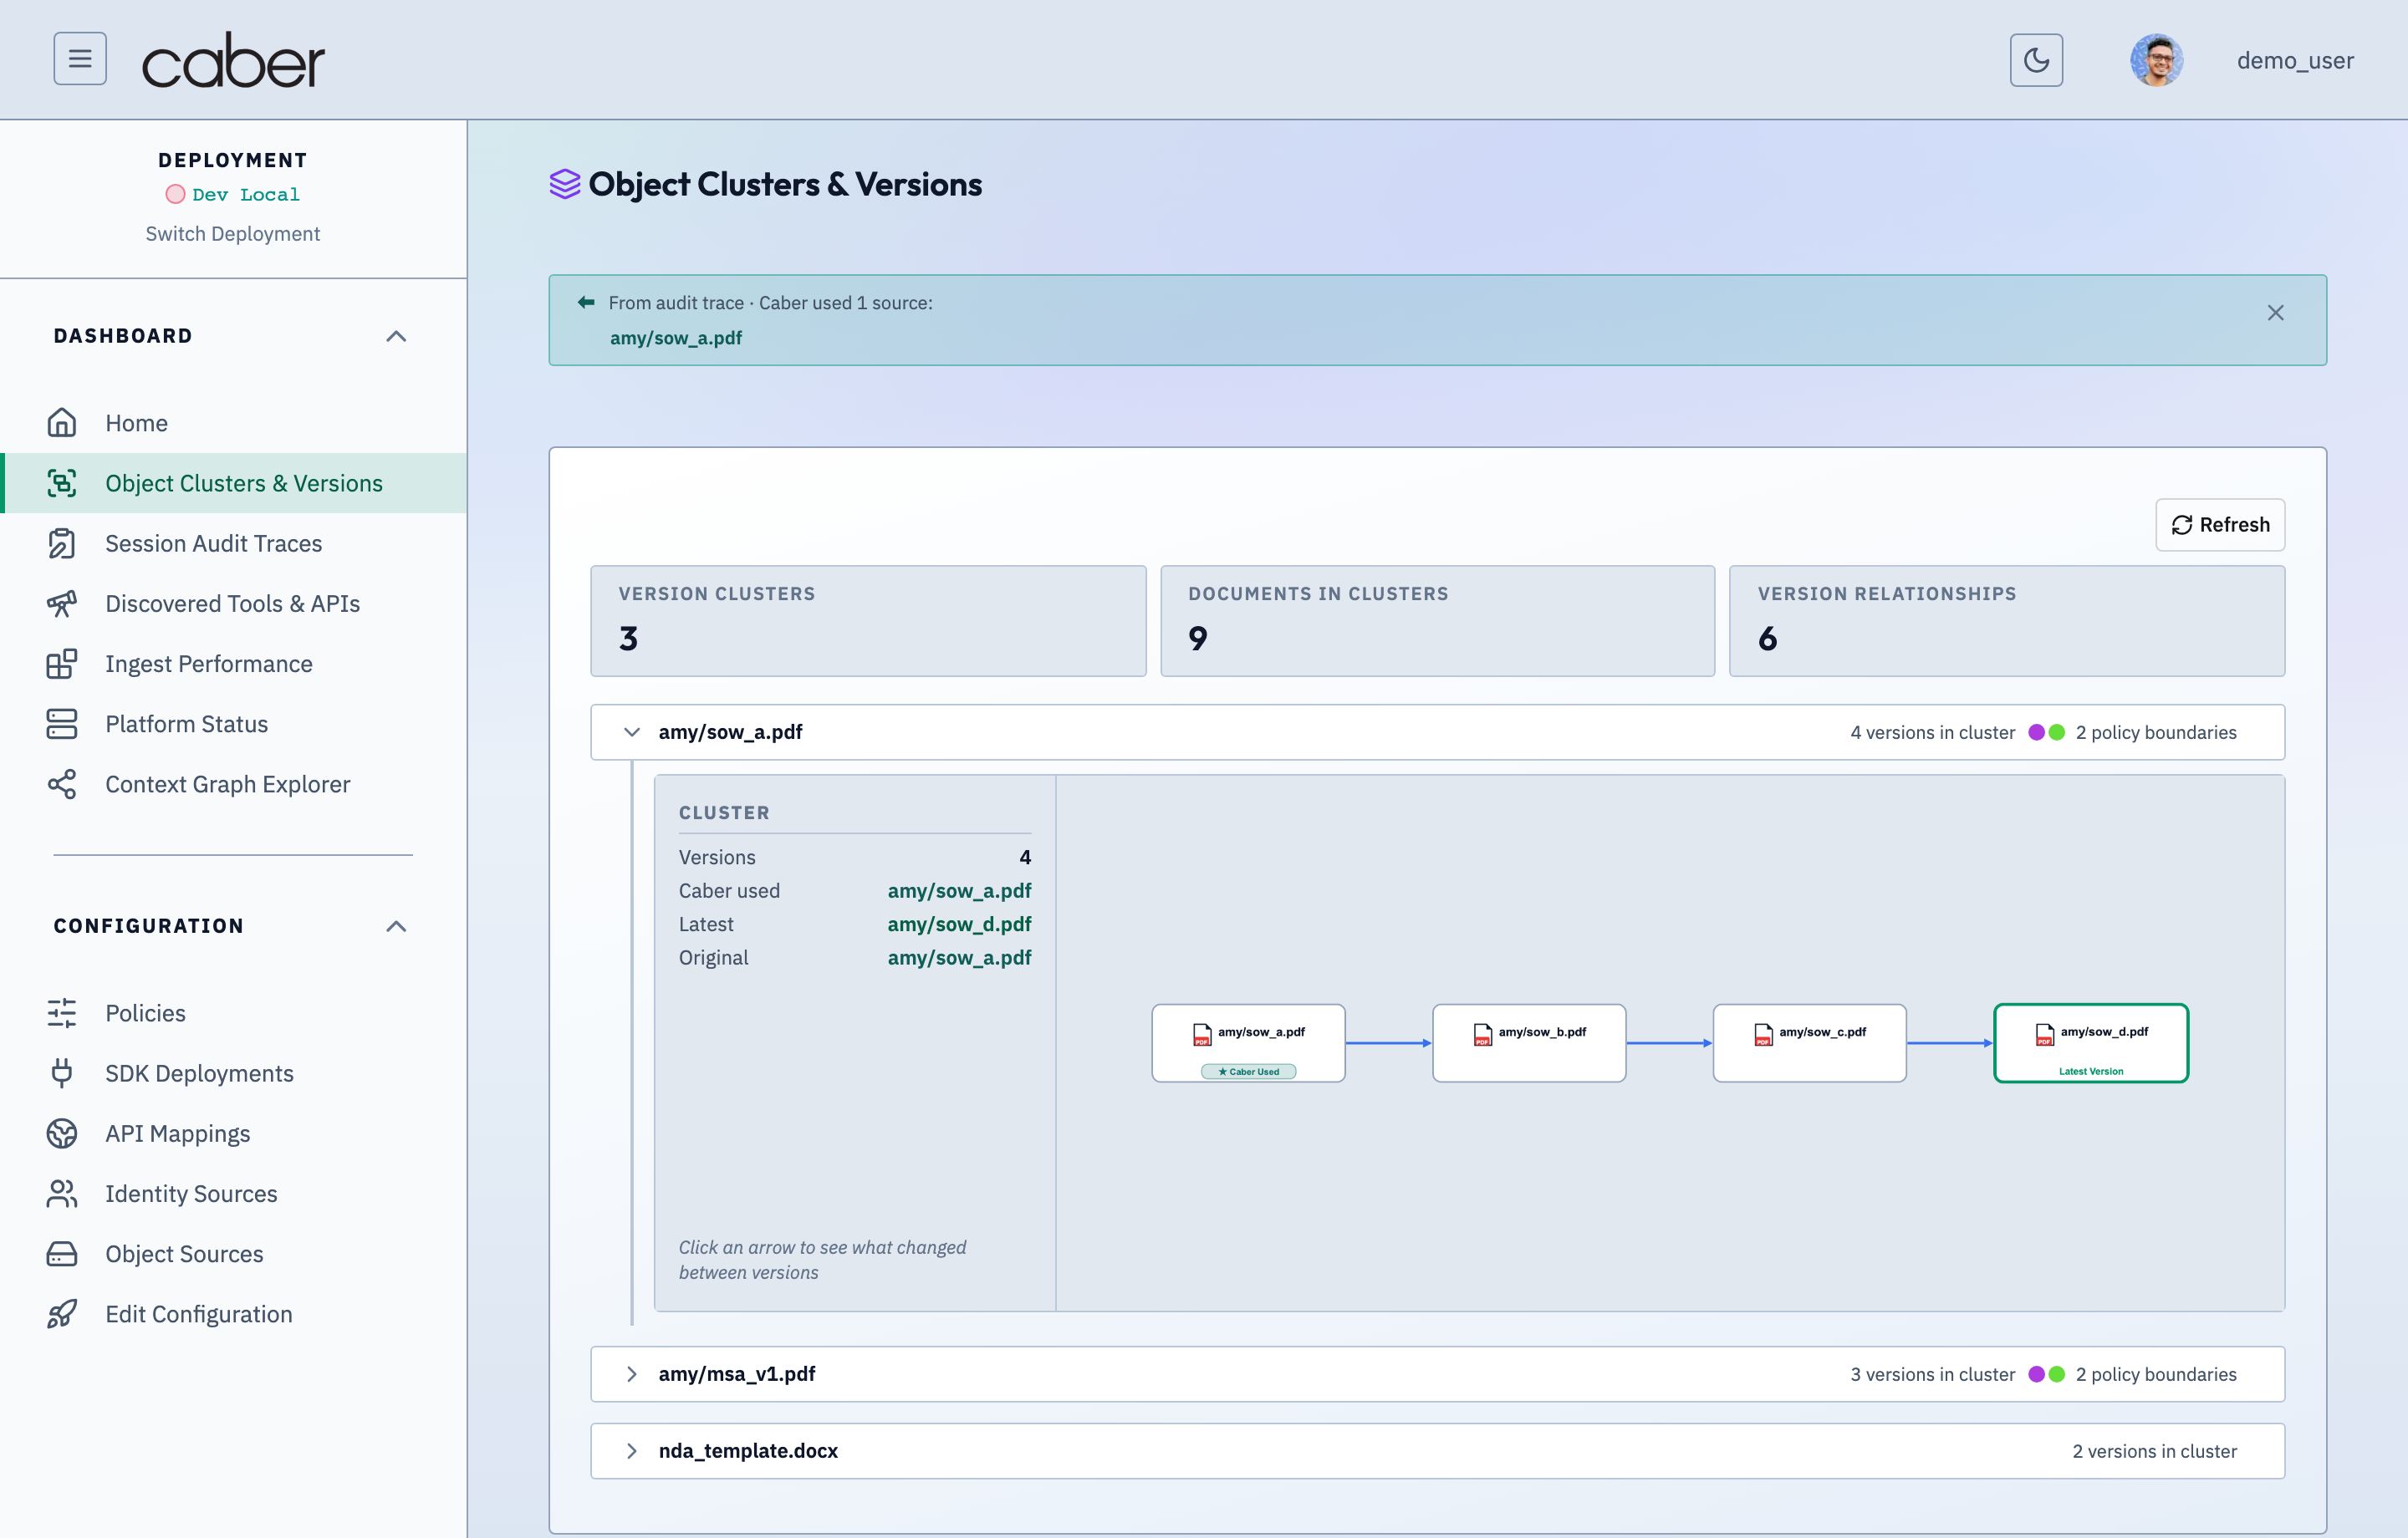
Clicking any cluster row expands the interactive Cluster Timeline Graph (ClusterTimelineGraph) rendered with Cytoscape and the ELK layered layout engine.
/admin/overlappingDuplicate Data Tracker with Expanded Cluster Lineage GraphAssertion Verified: Proves that expanding a duplicate cluster row in /admin/overlapping renders an interactive directed lineage graph distinguishing the canonical fresh origin (seq=0) from downstream stale replicas and partial forks.
The expanded cluster view provides left hand lineage metadata alongside the interactive DAG canvas:
- Cluster Metadata Rail: Lists total versions in the cluster, which version Caber used during the audited session, the Latest (
head) version in green, and the Original root candidate in blue, plus a Date Check warning whenever filelast_modifiedtimestamps contradict content containment ordering. - Corrected versus Pre Time Corrections Toggle: When timestamp anomalies exist, operators can switch between
Corrected(blended content plus timestamp ordering) andPre-Time Corrections(pure content containment ordering). - Node Badges and Policy Boundary Hulls:
- Original Candidate: Pinned to the leftmost layer of the
DAG. - Latest Version (
head): Highlighted with a green border and pinned to the rightmost layer. - Caber Used (
★ Caber Used): Marks the exact document version retrieved by the agent. - Policy Boundary Hulls (
PolicyLegend): When versions inside the same cluster fall under two or more distinct governance policies, translucent convex hulls surround each policy group so operators immediately see where a clause crossed an authorization boundary.
- Original Candidate: Pinned to the leftmost layer of the
Side by Side Document Comparison and Shared Nmer Inspector
Clicking any directed edge (arrow) between two version nodes in the cluster DAG opens the Overlap Comparison Panel (OverlapComparisonPanel) directly below the cluster card.
/admin/overlappingSide-by-Side Document Comparison & Shared WRL Span InspectorAssertion Verified: Proves that clicking an overlap edge or replica node opens a side-by-side Document Comparison view that highlights exact shared 40-byte WRL sub-sentence spans and diverging clauses across both documents.
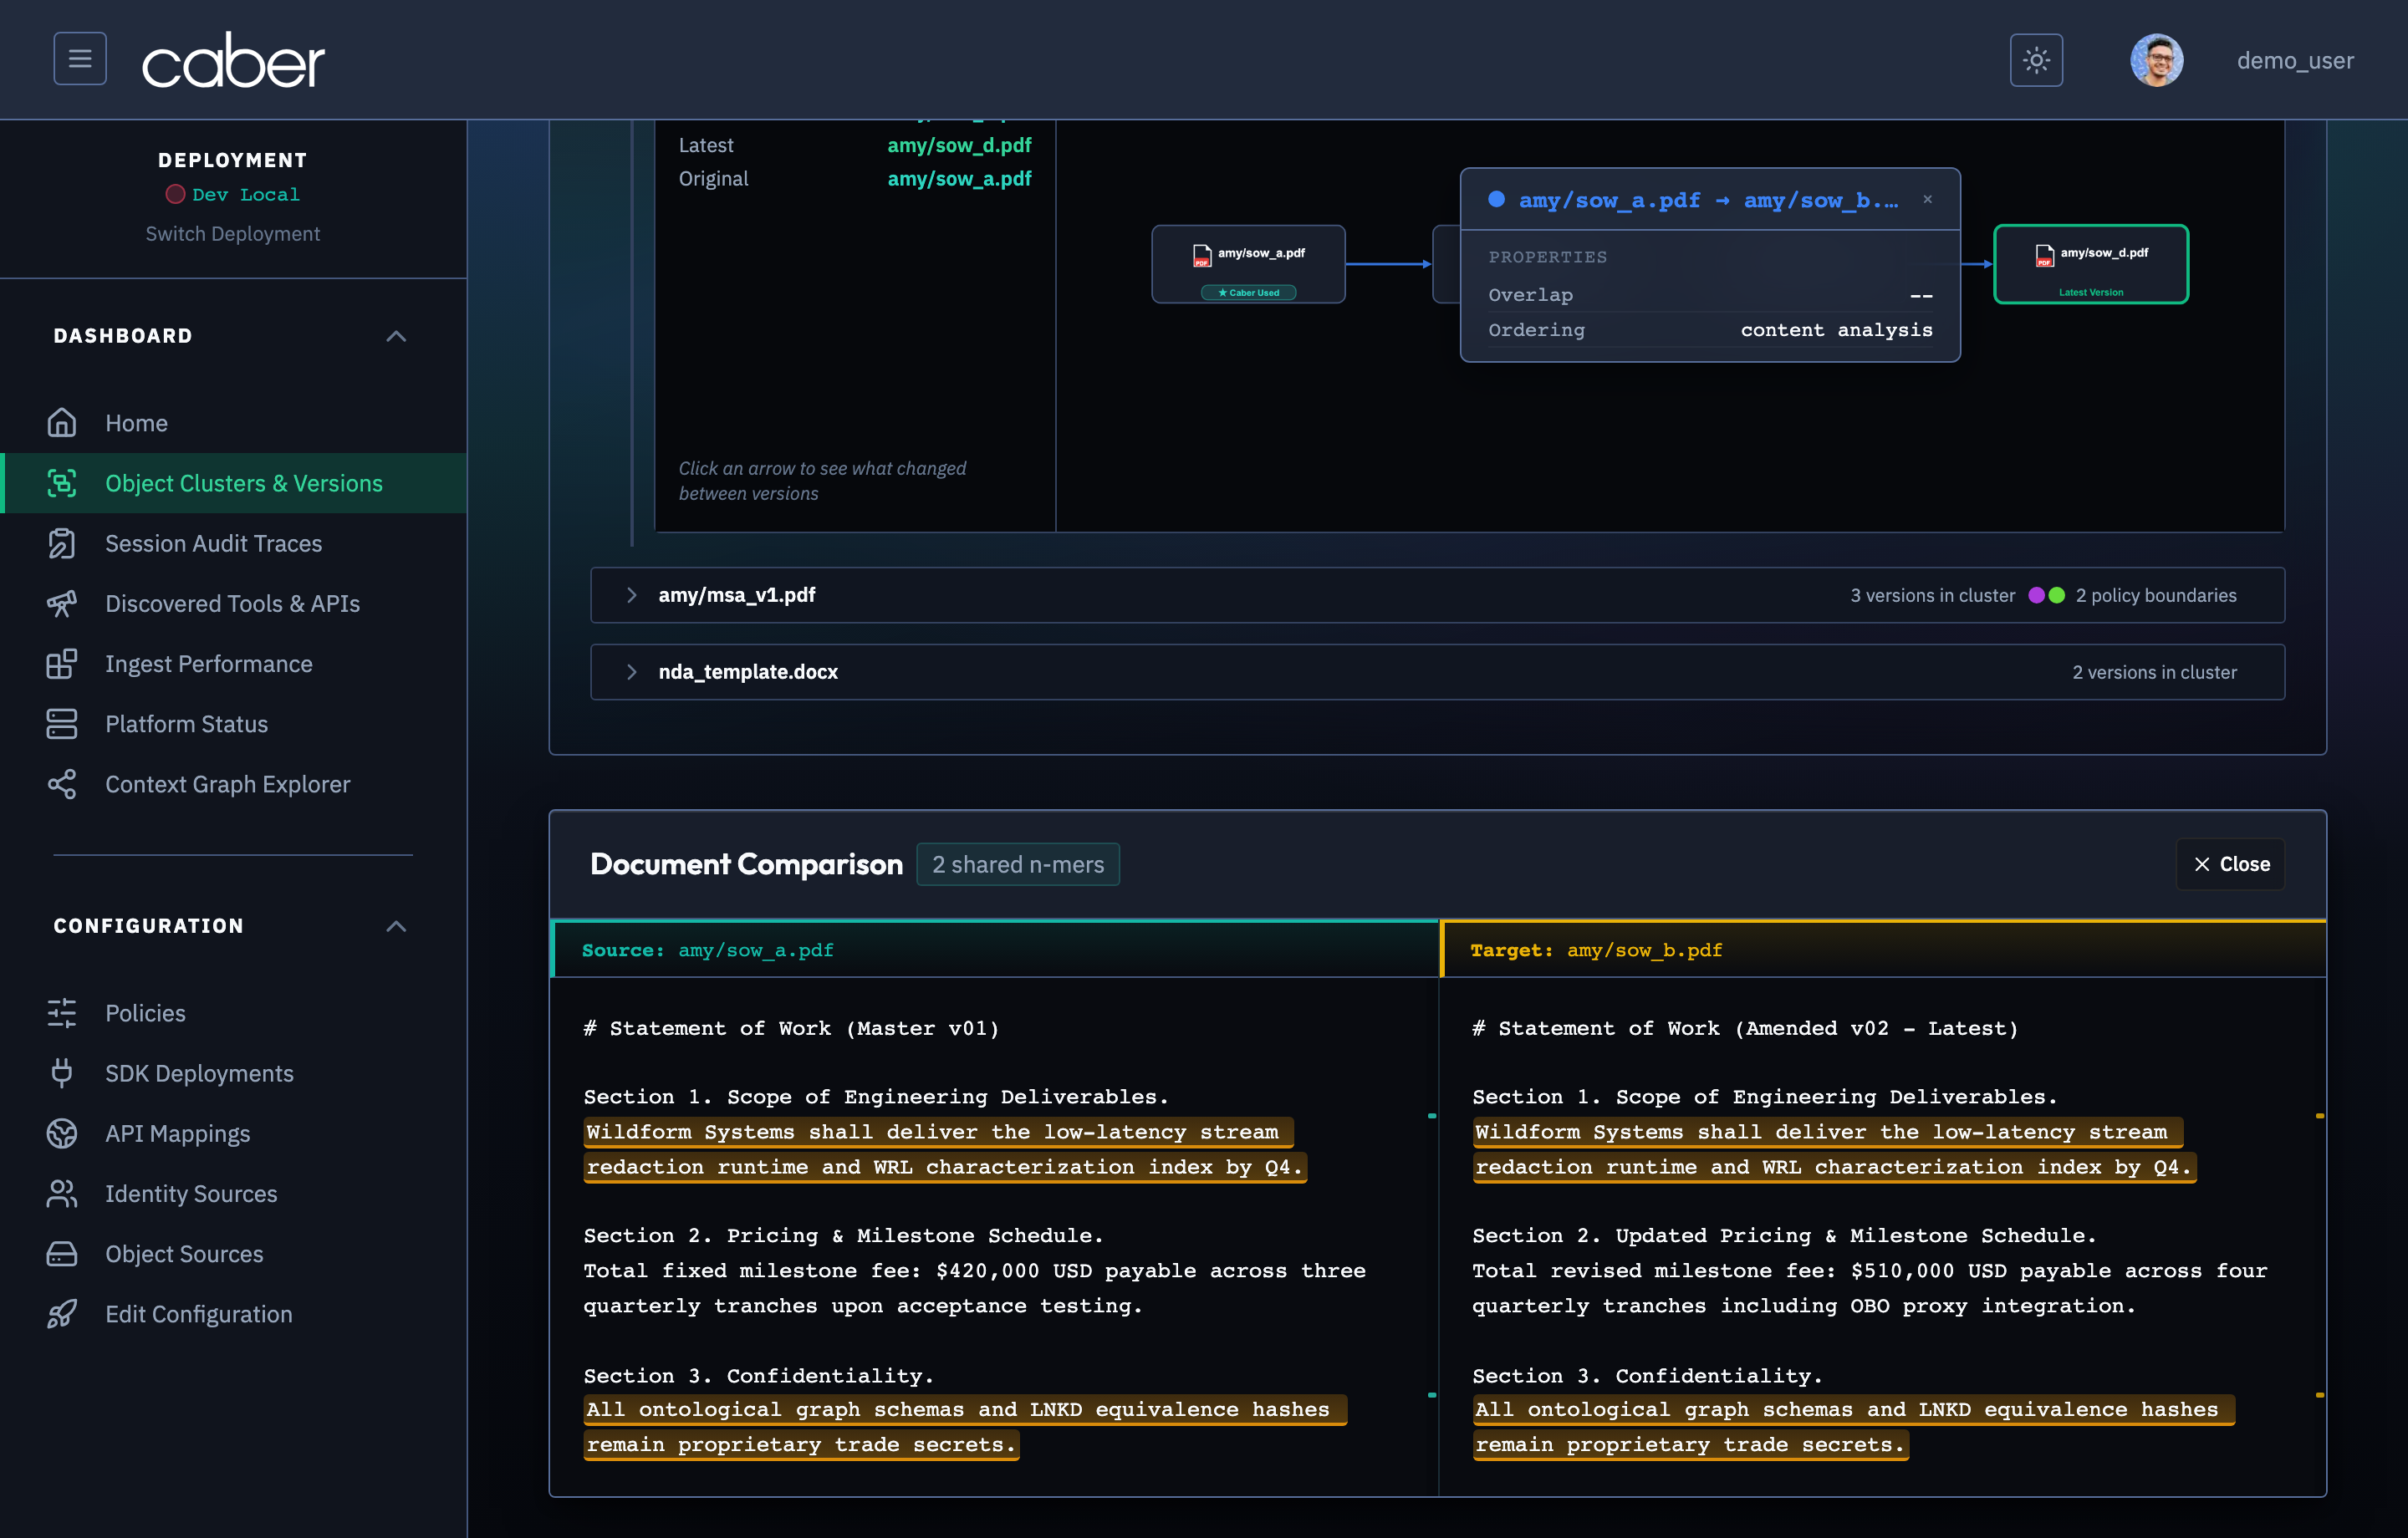
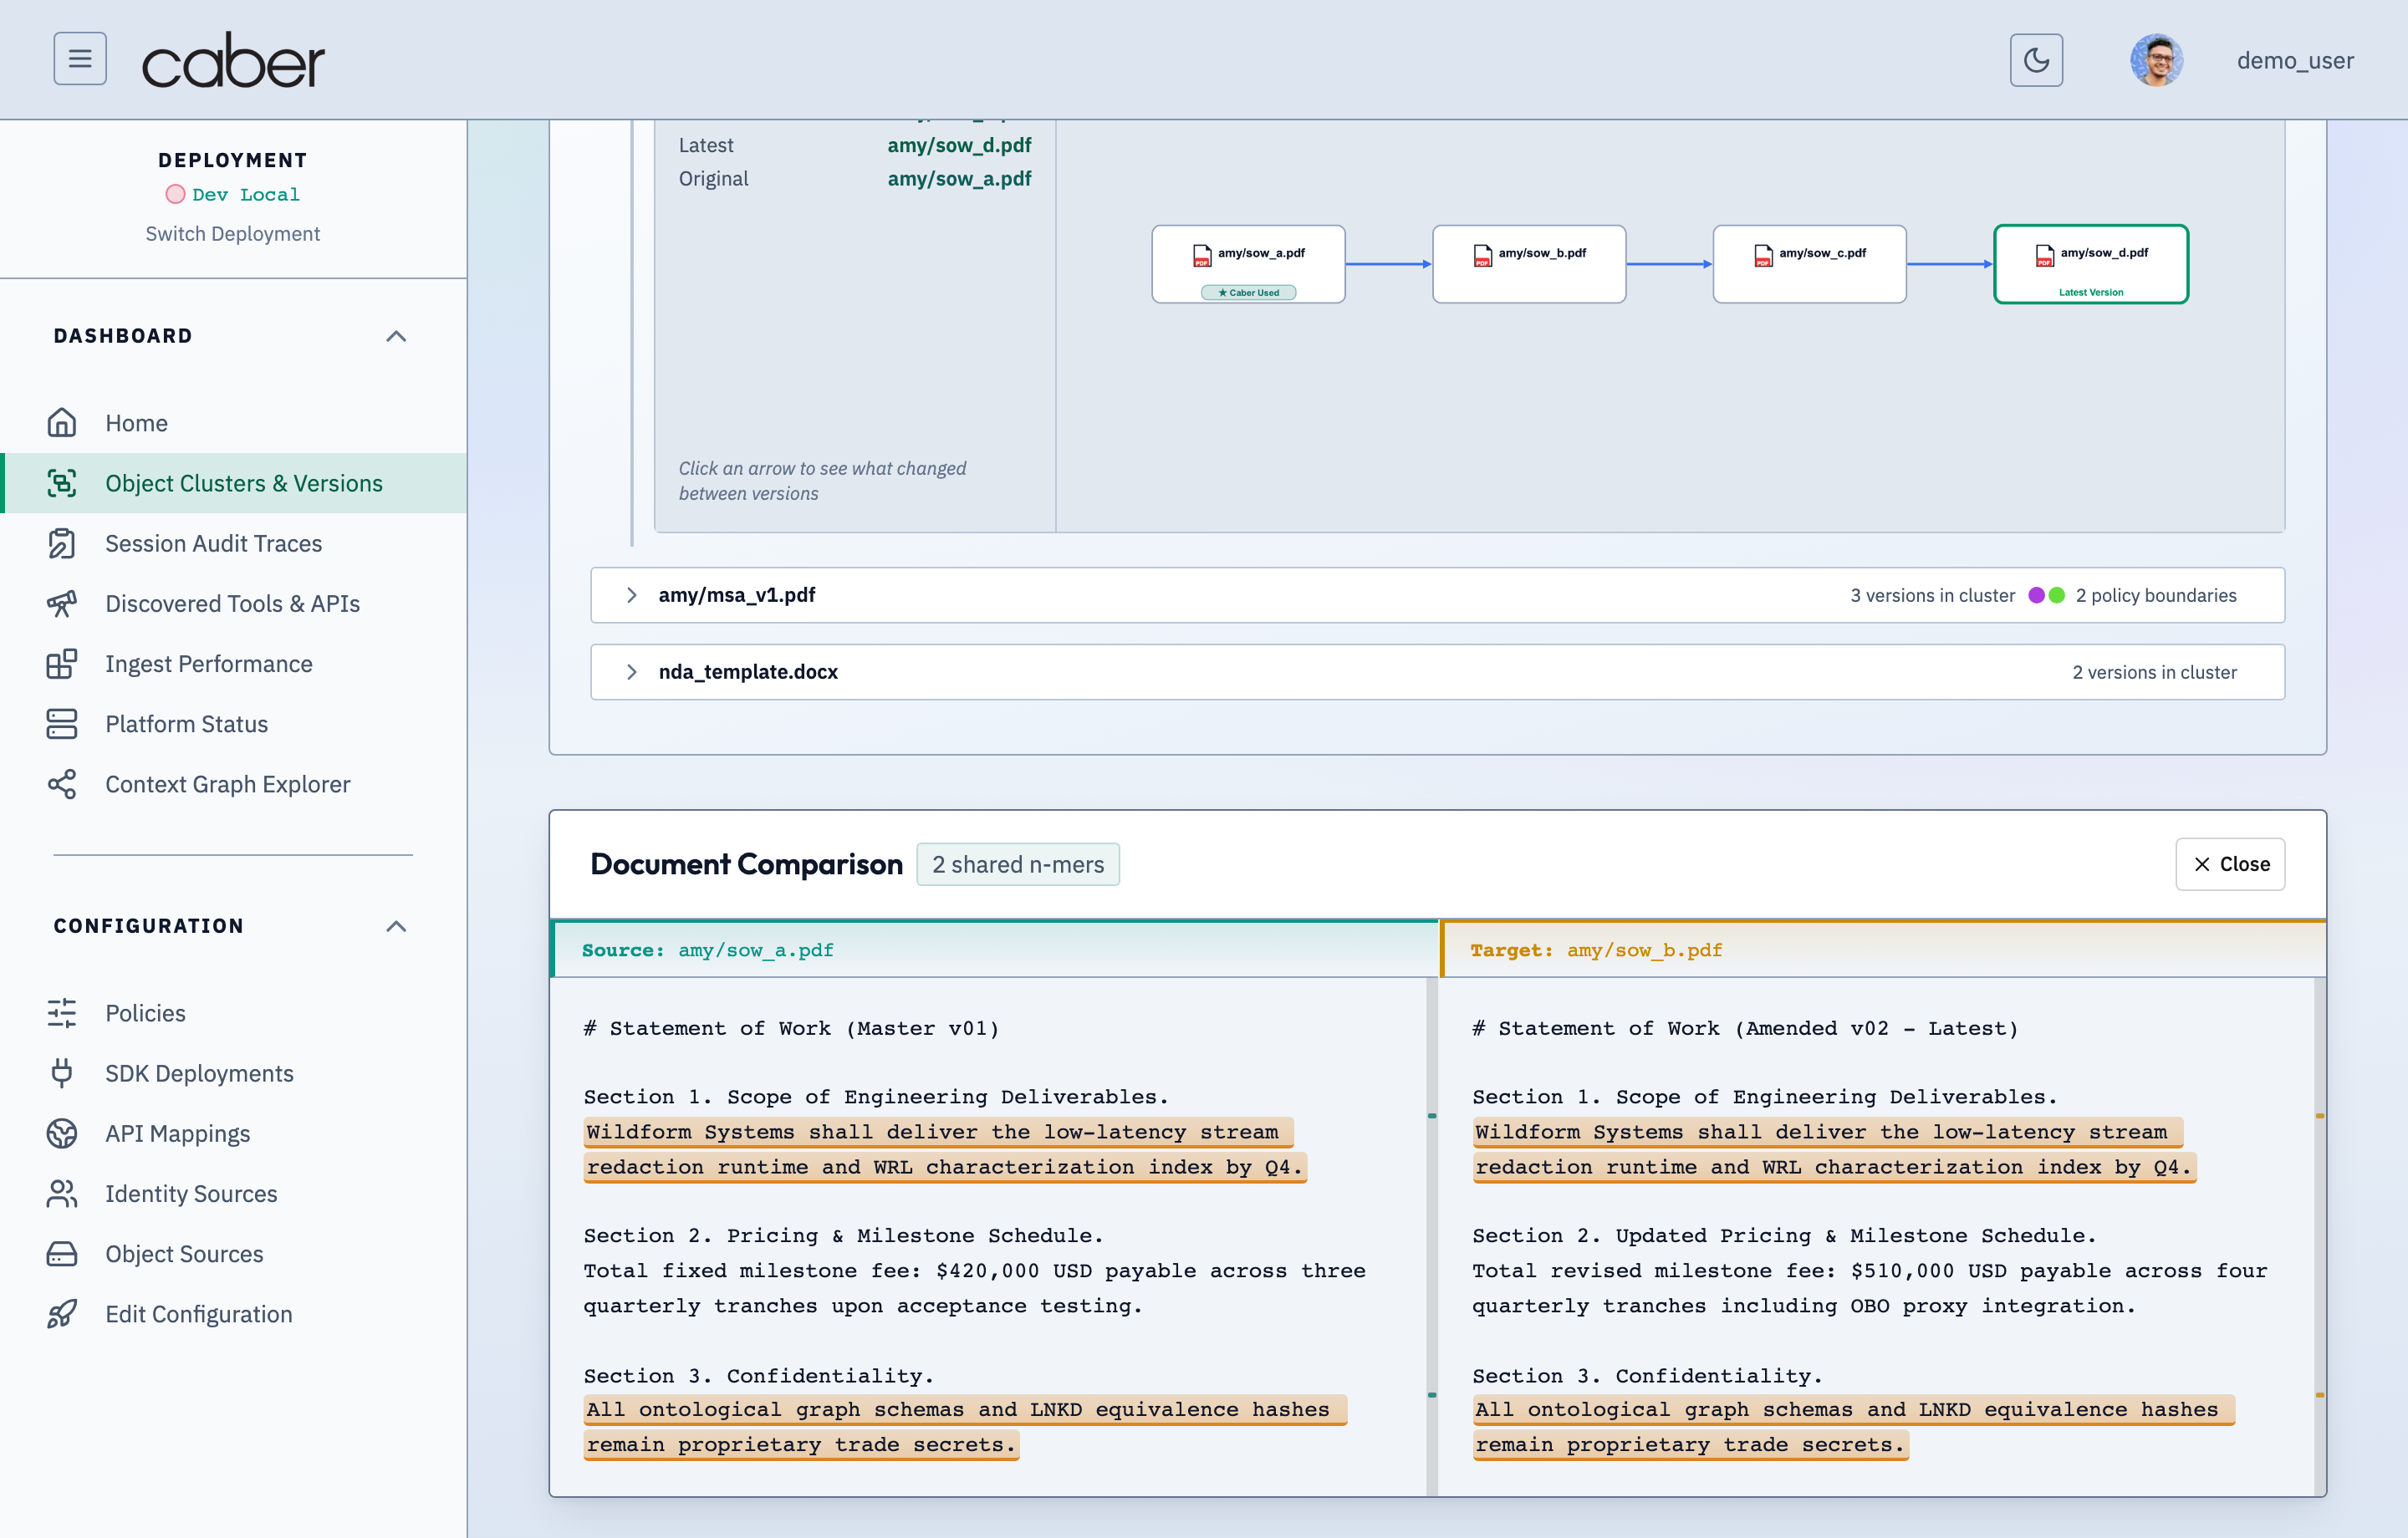
The comparison panel queries /api/overlap-compare for the selected source and target document paths and renders a synchronized forensic diff:
- Source and Target Document Panes: Displays the full reconstructed text of the parent version on the left and the derived version on the right, complete with MIME type badges and byte counts.
- Shared Subsentence Highlighting (
shared_nmers): Highlights every sharedLNKDequivalence span across both panes. Clicking a highlighted span in either document scrolls the opposite pane to the matching clause and displays the underlyingnmer_hash. - Dismissing the Comparison: Clicking the
Close comparisonbutton (X) or clicking the sameDAGedge a second time closes the diff panel.
Ingest Performance and Characterization Telemetry (/admin/scanning)
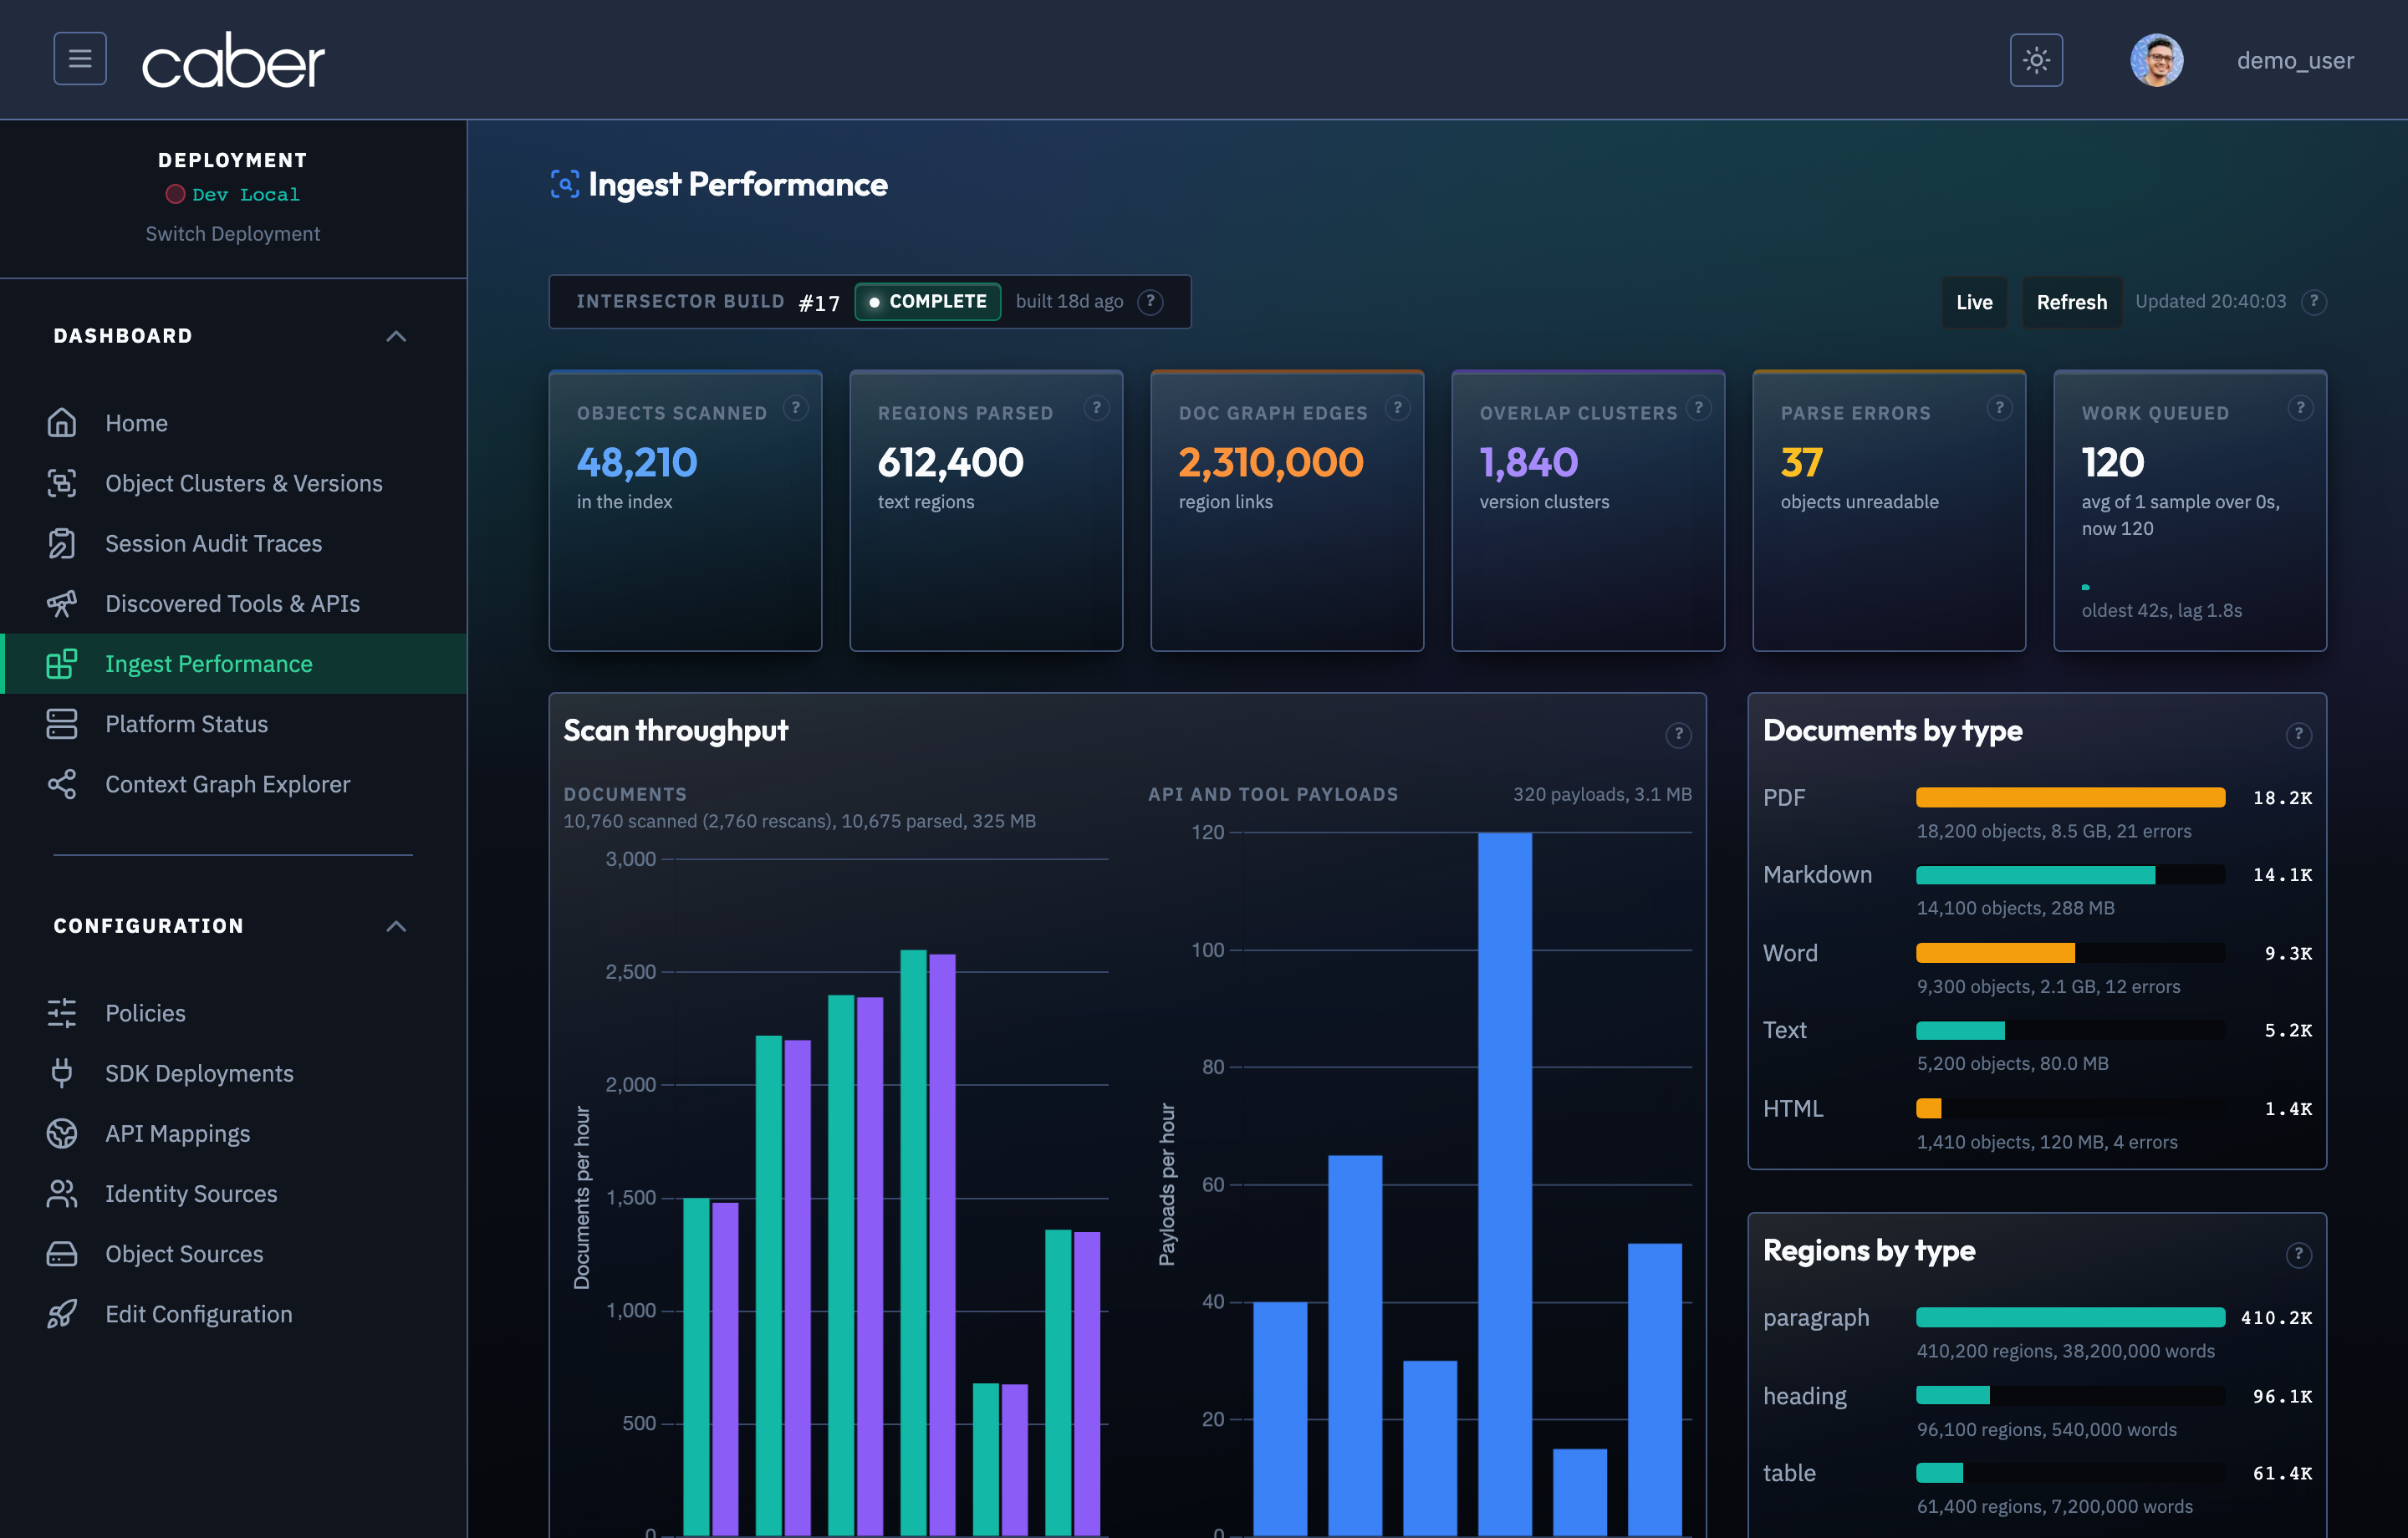
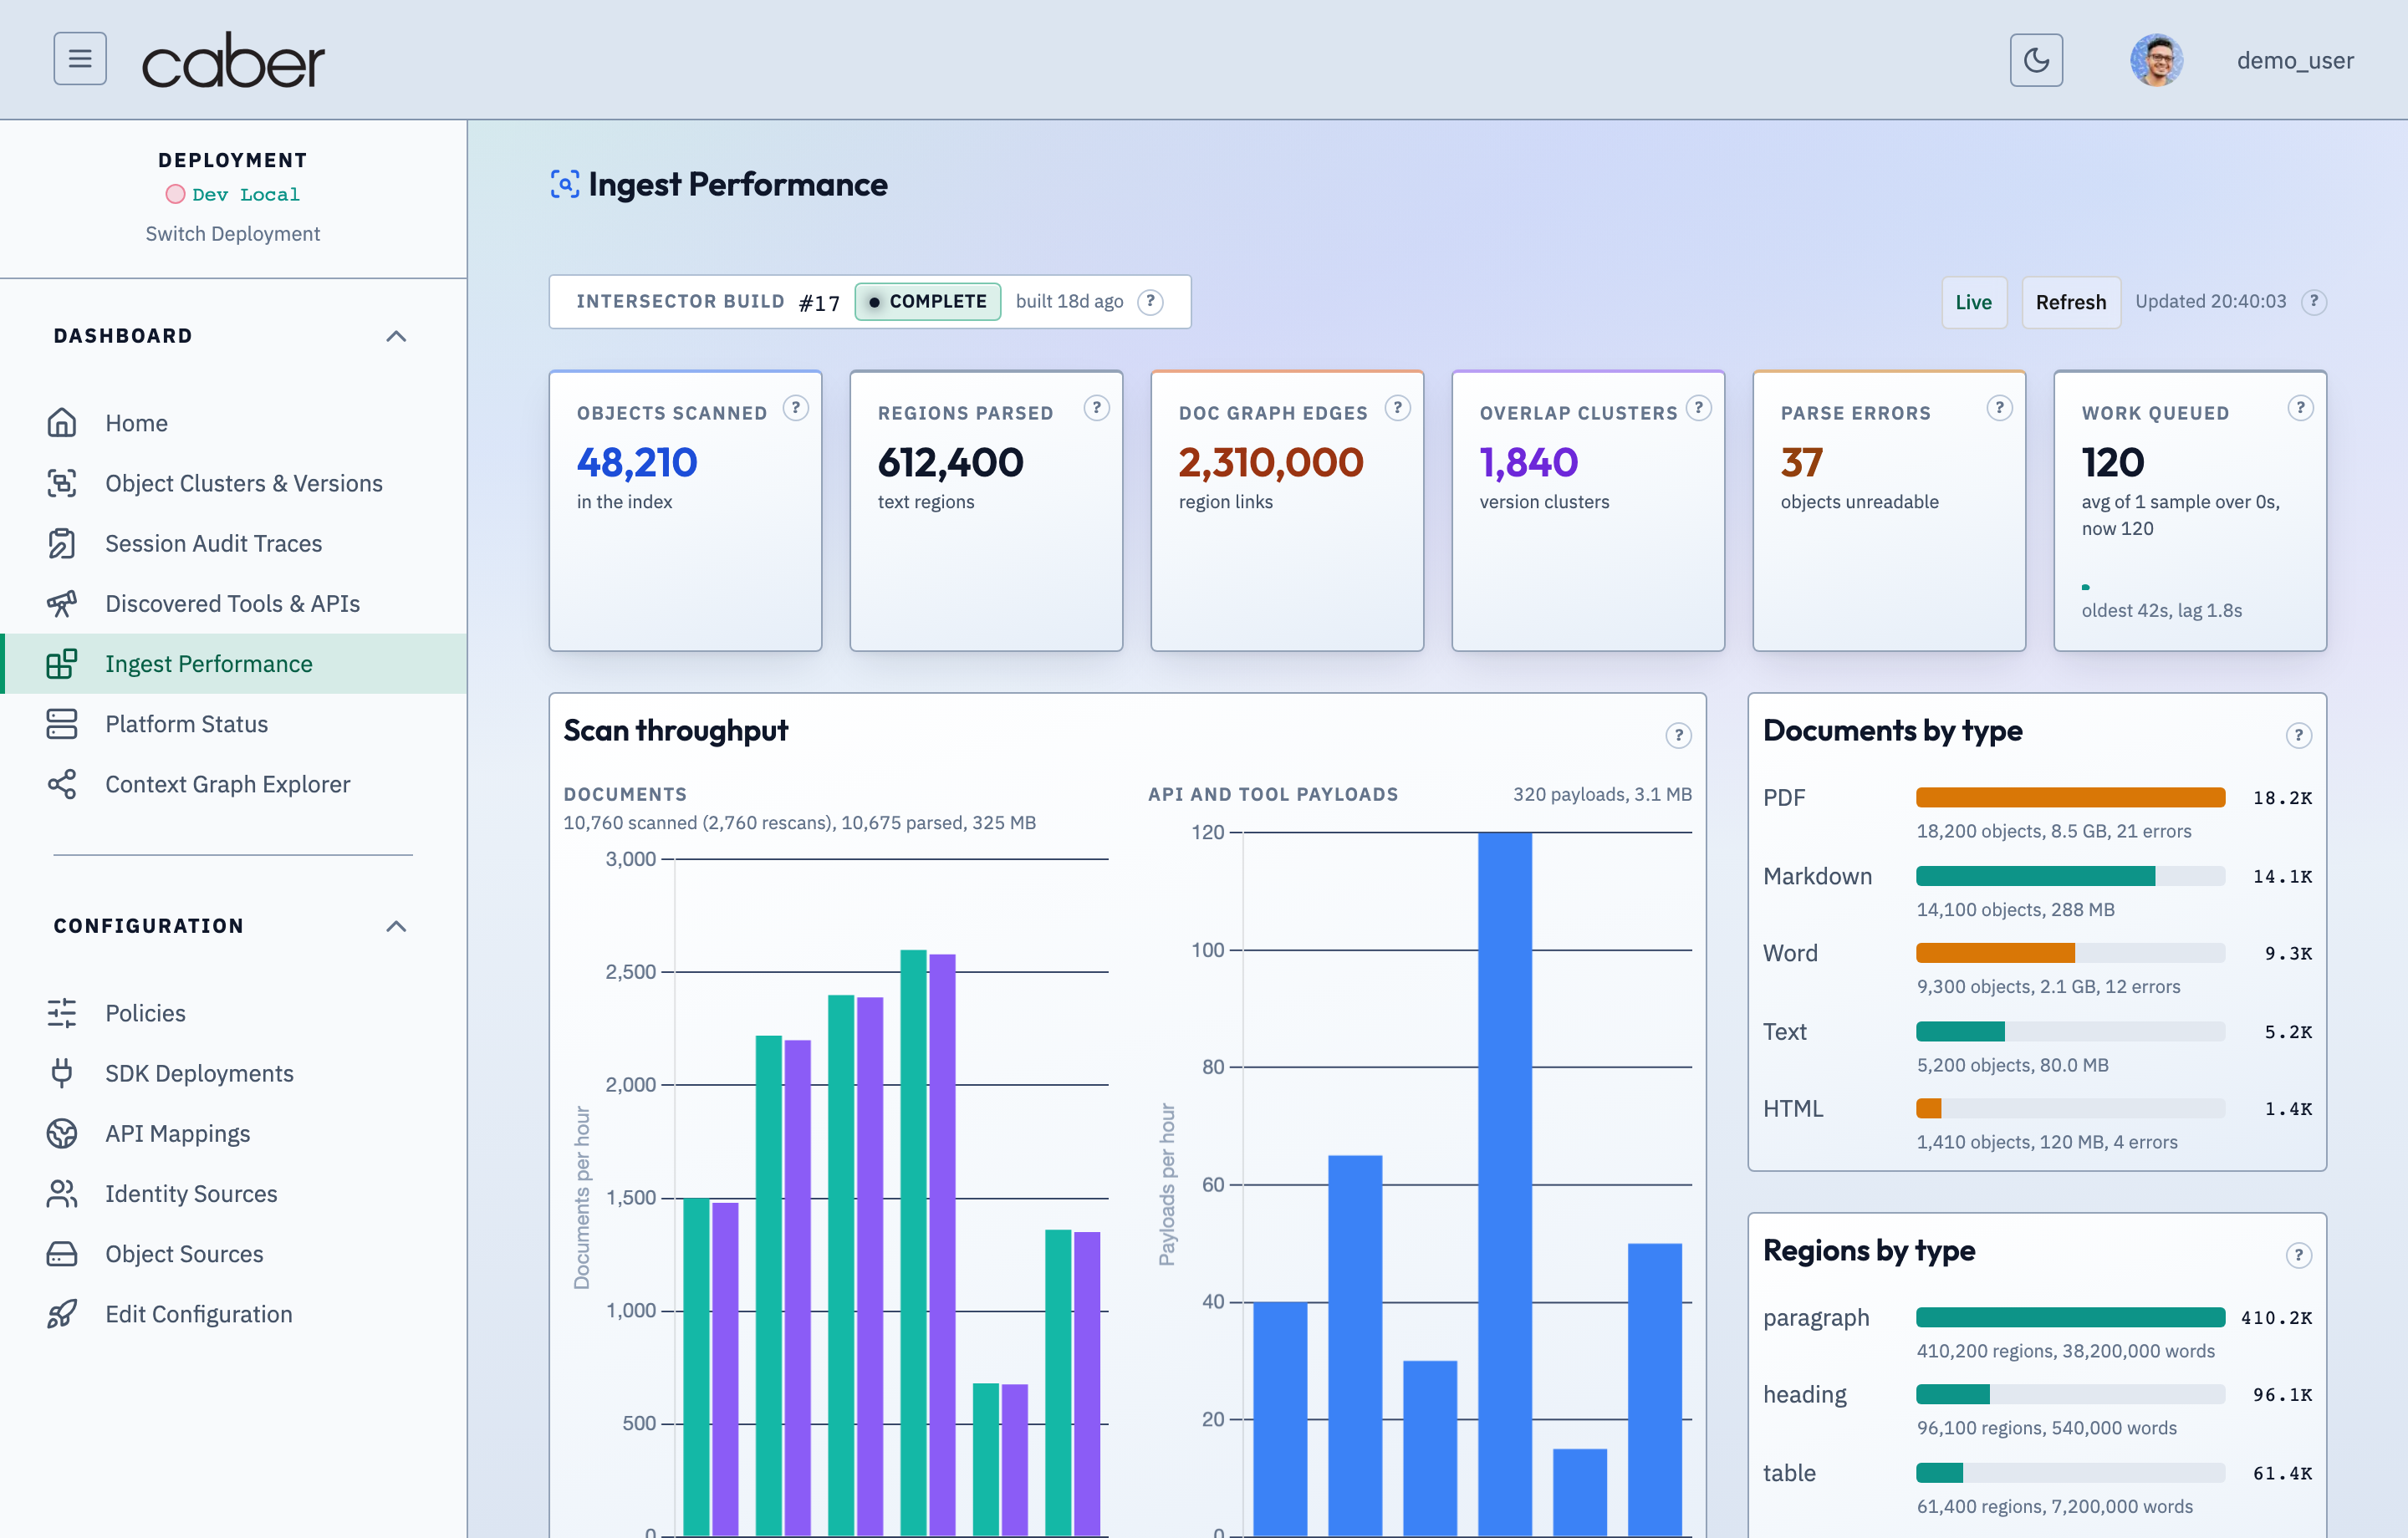
The Ingest Performance page (/admin/scanning) monitors the characterization pipeline as Caber scans object stores and SQL databases, extracts text and named entities (GLiNER), and populates the WRL Chunker (RKCQF) and RBIX roaring bitmap indexes.
/admin/scanningScanning & Ingestion Pipeline Performance TelemetryAssertion Verified: Proves that Caber tracks end-to-end document scanning, parser routing, WRL sub-sentence chunking, and RBIX roaring bitmap indexing performance with per-stage throughput and latency charts.
Characterization KPIs and Time Range Controls
Operators can filter /admin/scanning across preset windows (15m, 1h, 24h, 7d, 30d) to inspect four primary characterization panels:
- Scan Summary Ribbon (
/api/scan/summary): Reports total objects scanned, total bytes characterized, average characterization time per document, and active queue depth. - Throughput Timeline (
/api/scan/throughput): Plots documents per minute and megabytes per second processed by the characterization workers over time. - Documents by Format (
/api/scan/documents-by-type): Breaks down ingested objects by MIME type and parser pipeline (PDF,DOCX,Markdown,XLSX,HTML,JSON). - Detected Region & Entity Categories (
/api/scan/regions) and Source Health (/api/scan/sources): Shows the distribution of extractedGLiNERsensitivity labels (PERSON,ORGANIZATION,ACCOUNT_NUMBER,ROYALTY_RATE) and per bucket scan completion status.
Platform Status and Container Logs (/admin/platform)
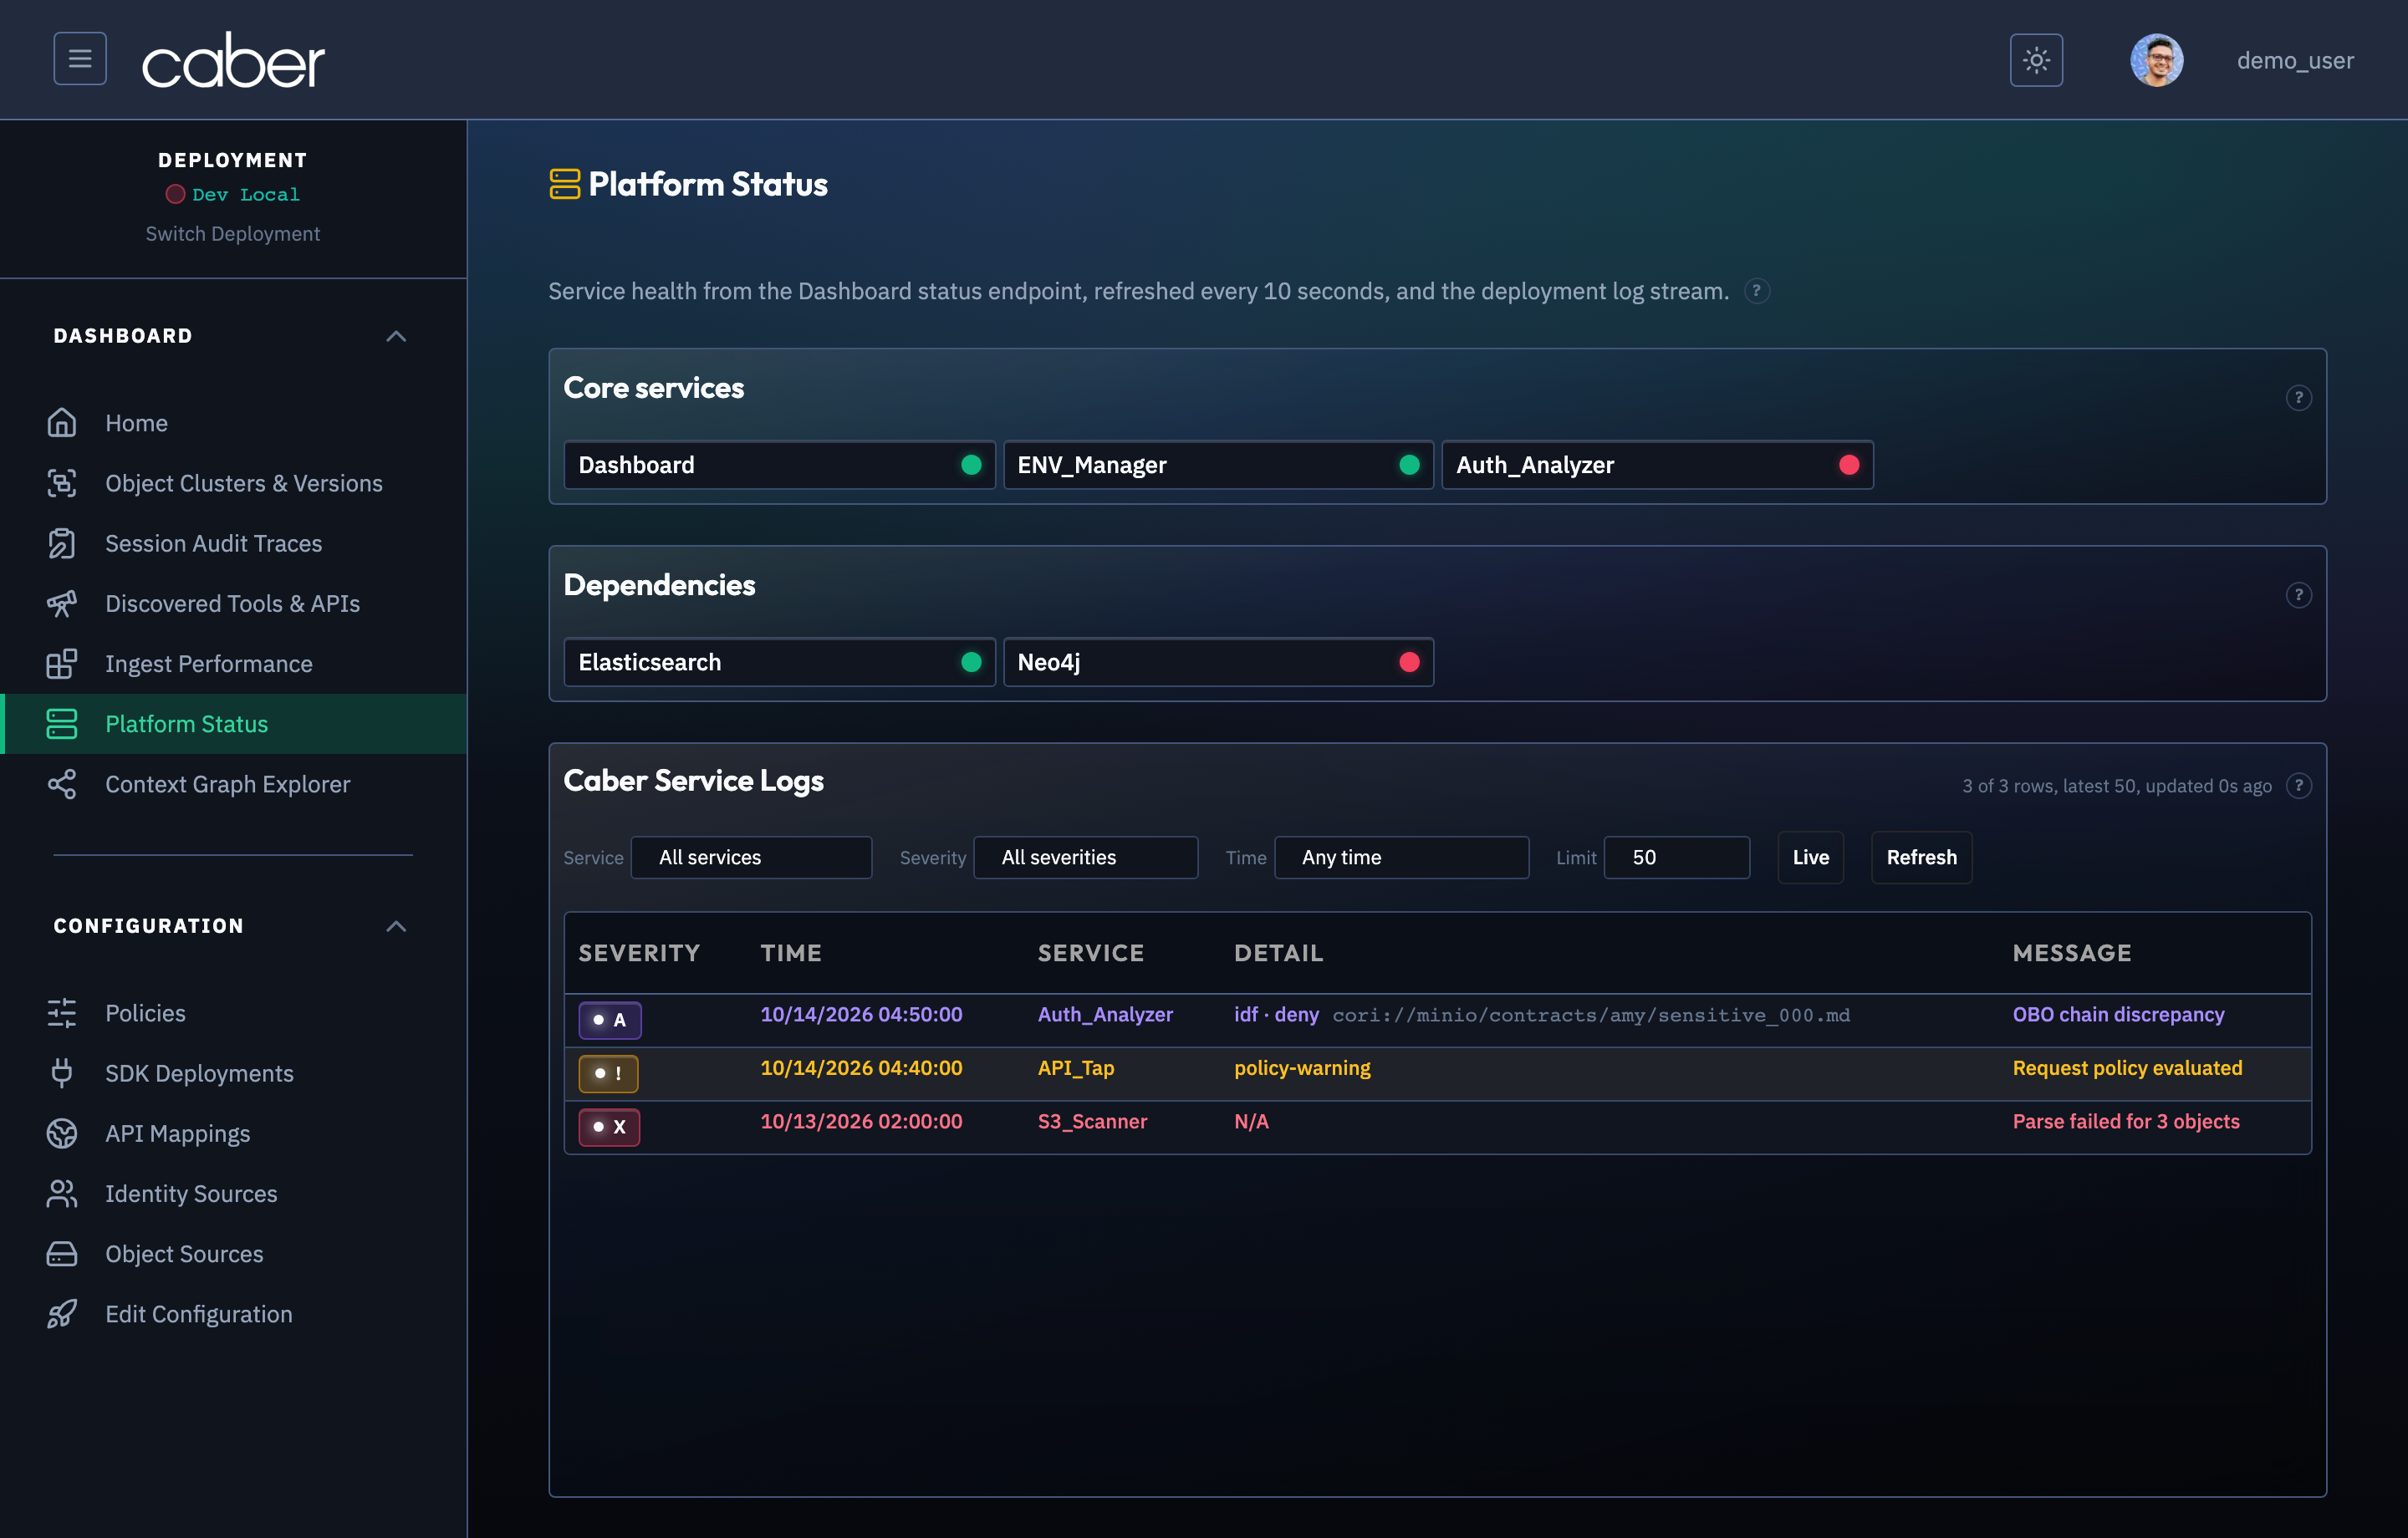
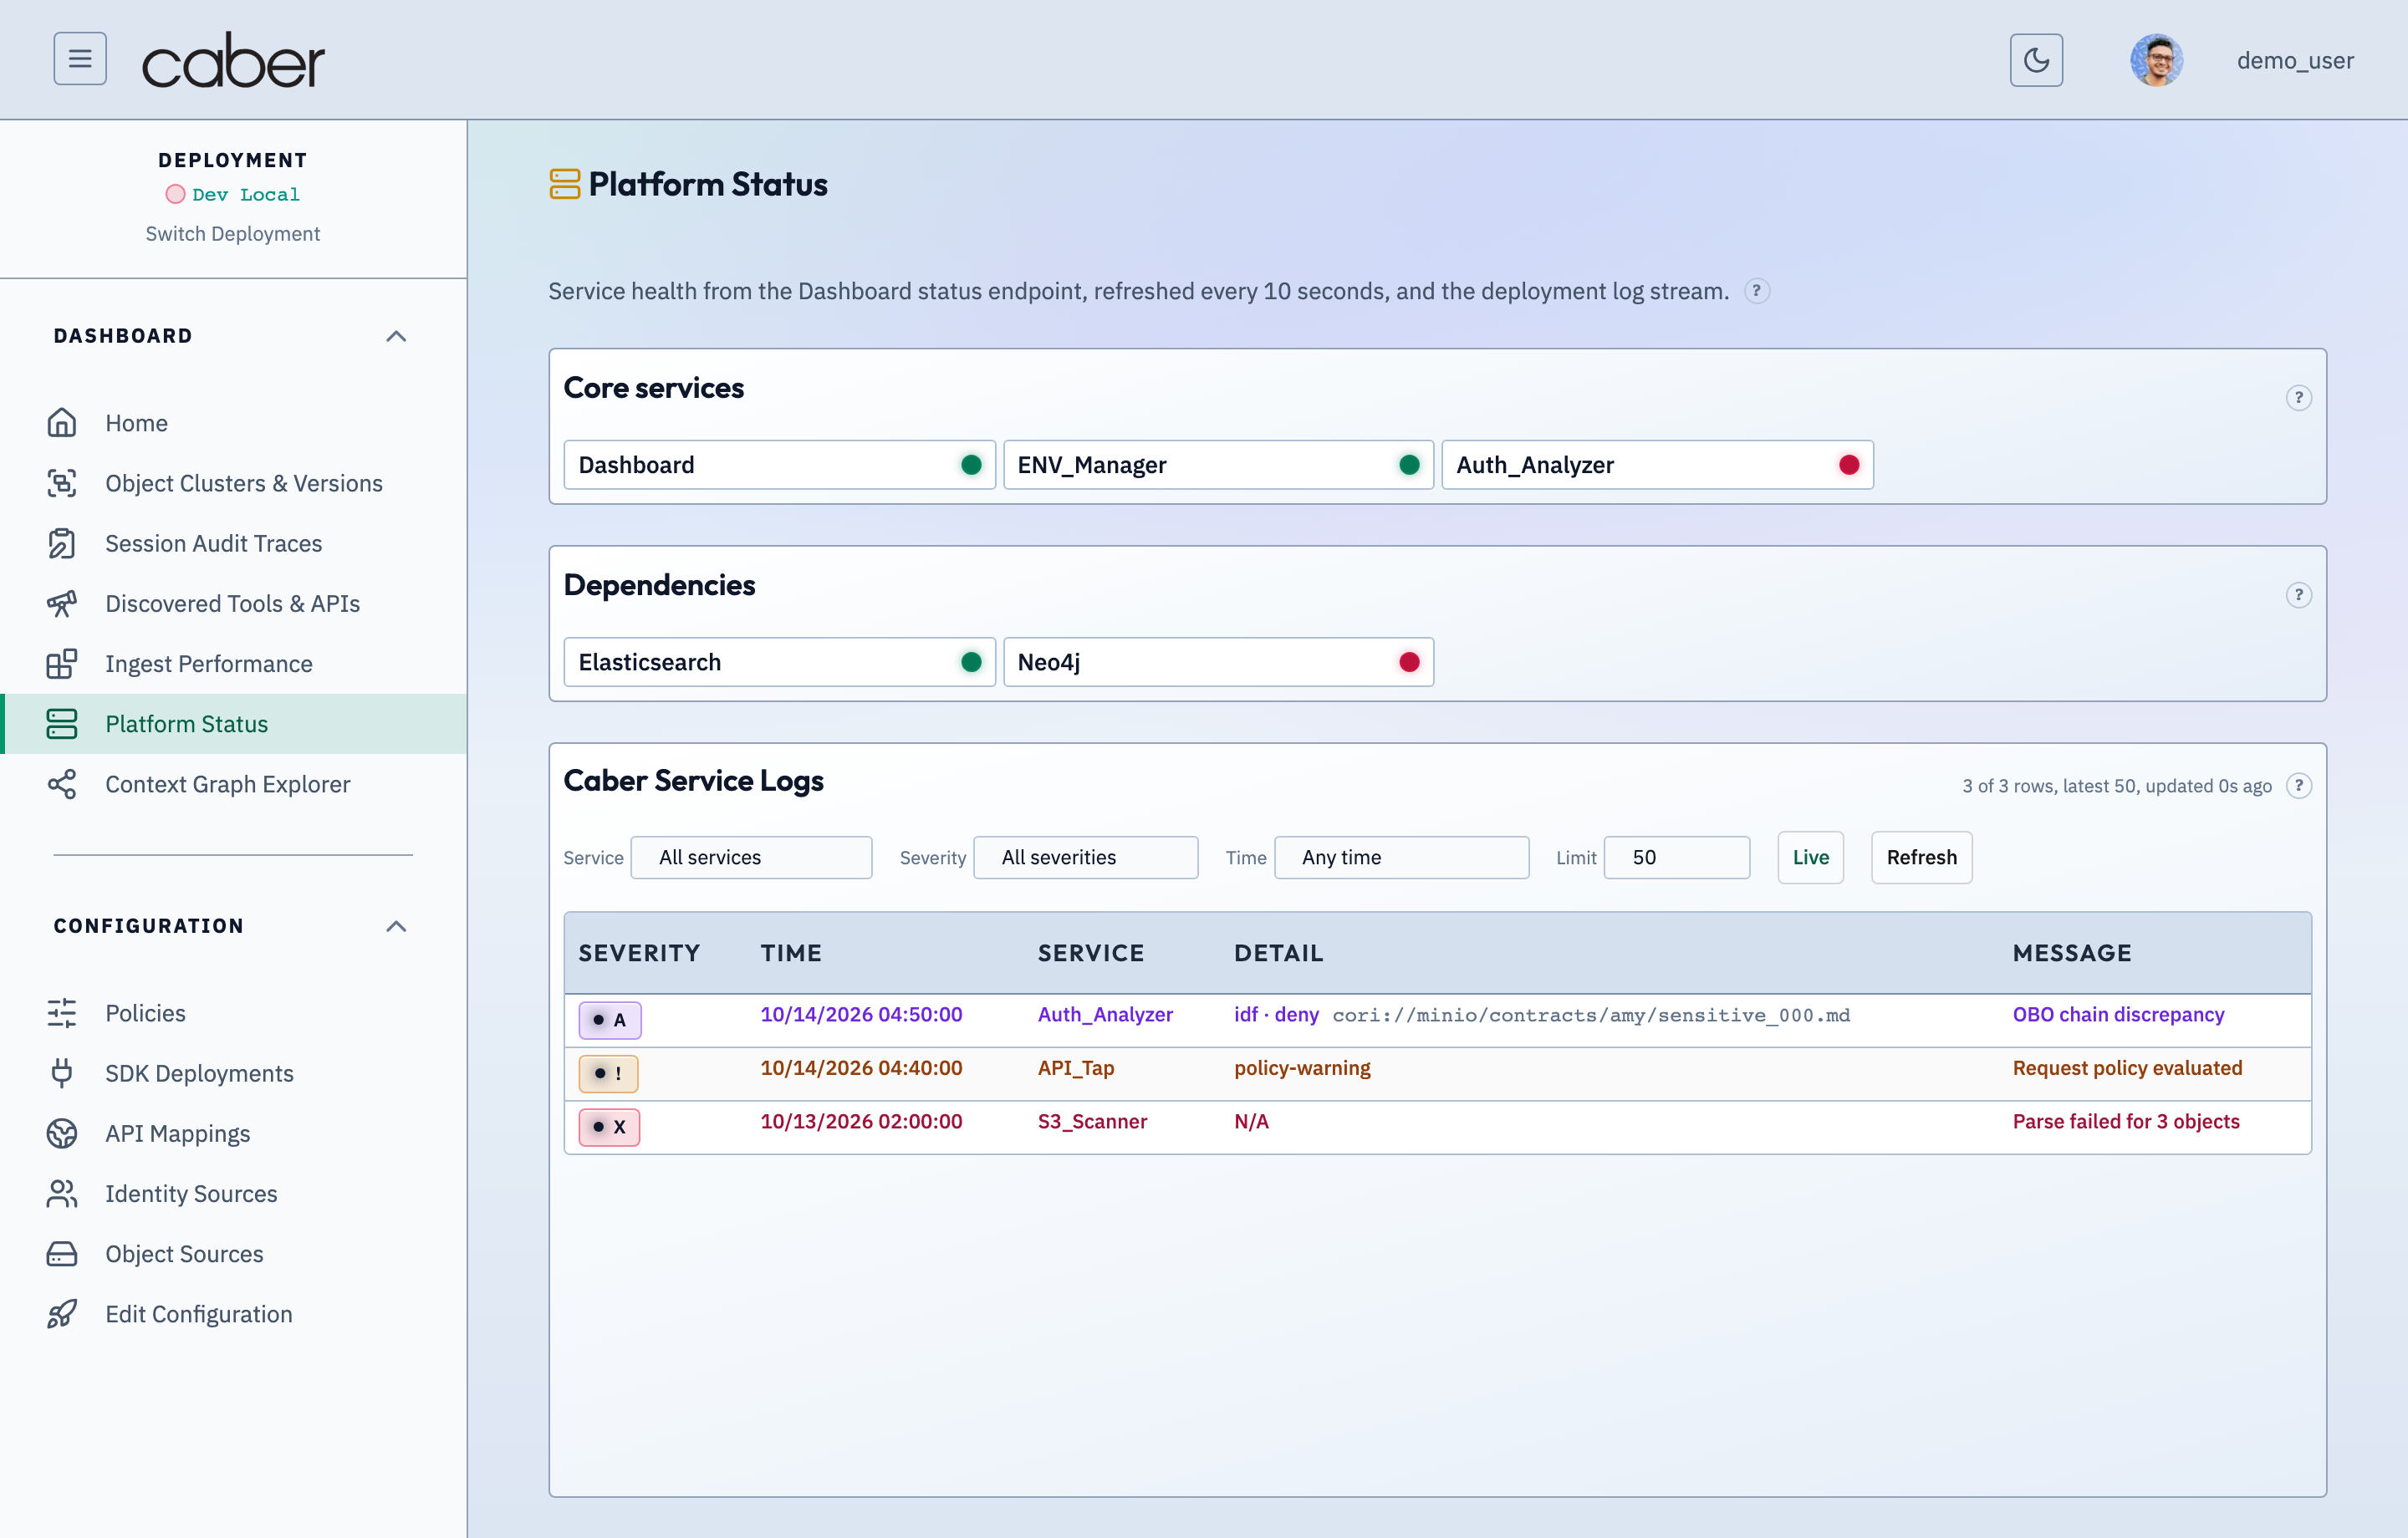
The Platform Status page (/admin/platform) provides infrastructure health monitoring and live log inspection across all Caber runtime services.
/admin/platformPlatform Infrastructure Status & Live Container Log InspectorAssertion Verified: Proves that operators can monitor real-time health probes across all backing data stores (OpenSearch, Neo4j, S3/VersityGW, PostgreSQL) and inspect structured service logs directly from /admin/platform.
- Service Health Cards (
data-testid="health-card-*"): Displays status indicators (Healthy,Degraded,Offline), uptime, and version metadata forcaber_core, OpenSearch, Neo4j, and connected storage endpoints. Hovering a health card reveals detailed probe diagnostics. - Filterable Service Logs (
/api/deployment-logs): Streams structured container logs with instant filtering by service (caber-core,opensearch,neo4j,scanner), severity level (INFO,WARN,ERROR), and free text search.
Context Graph Explorer and Analytical Views (/admin/contextGraph)
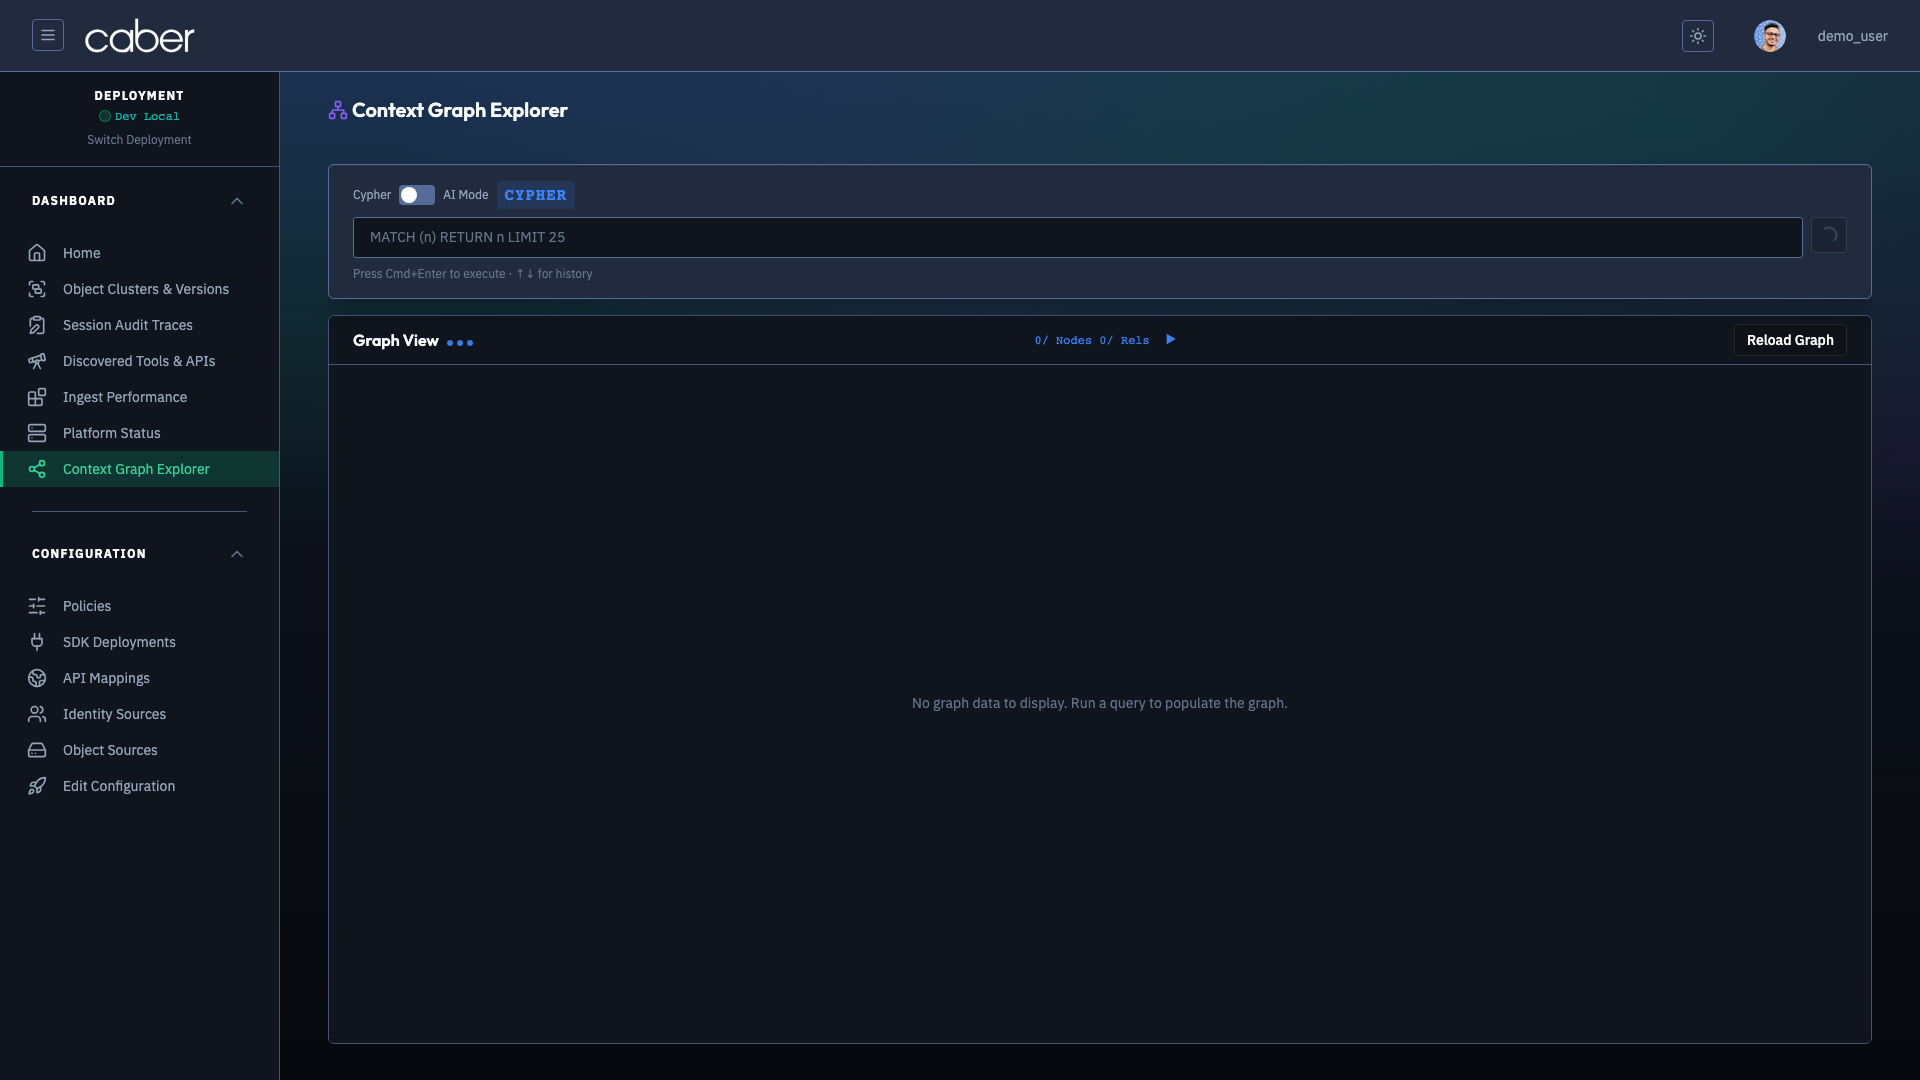
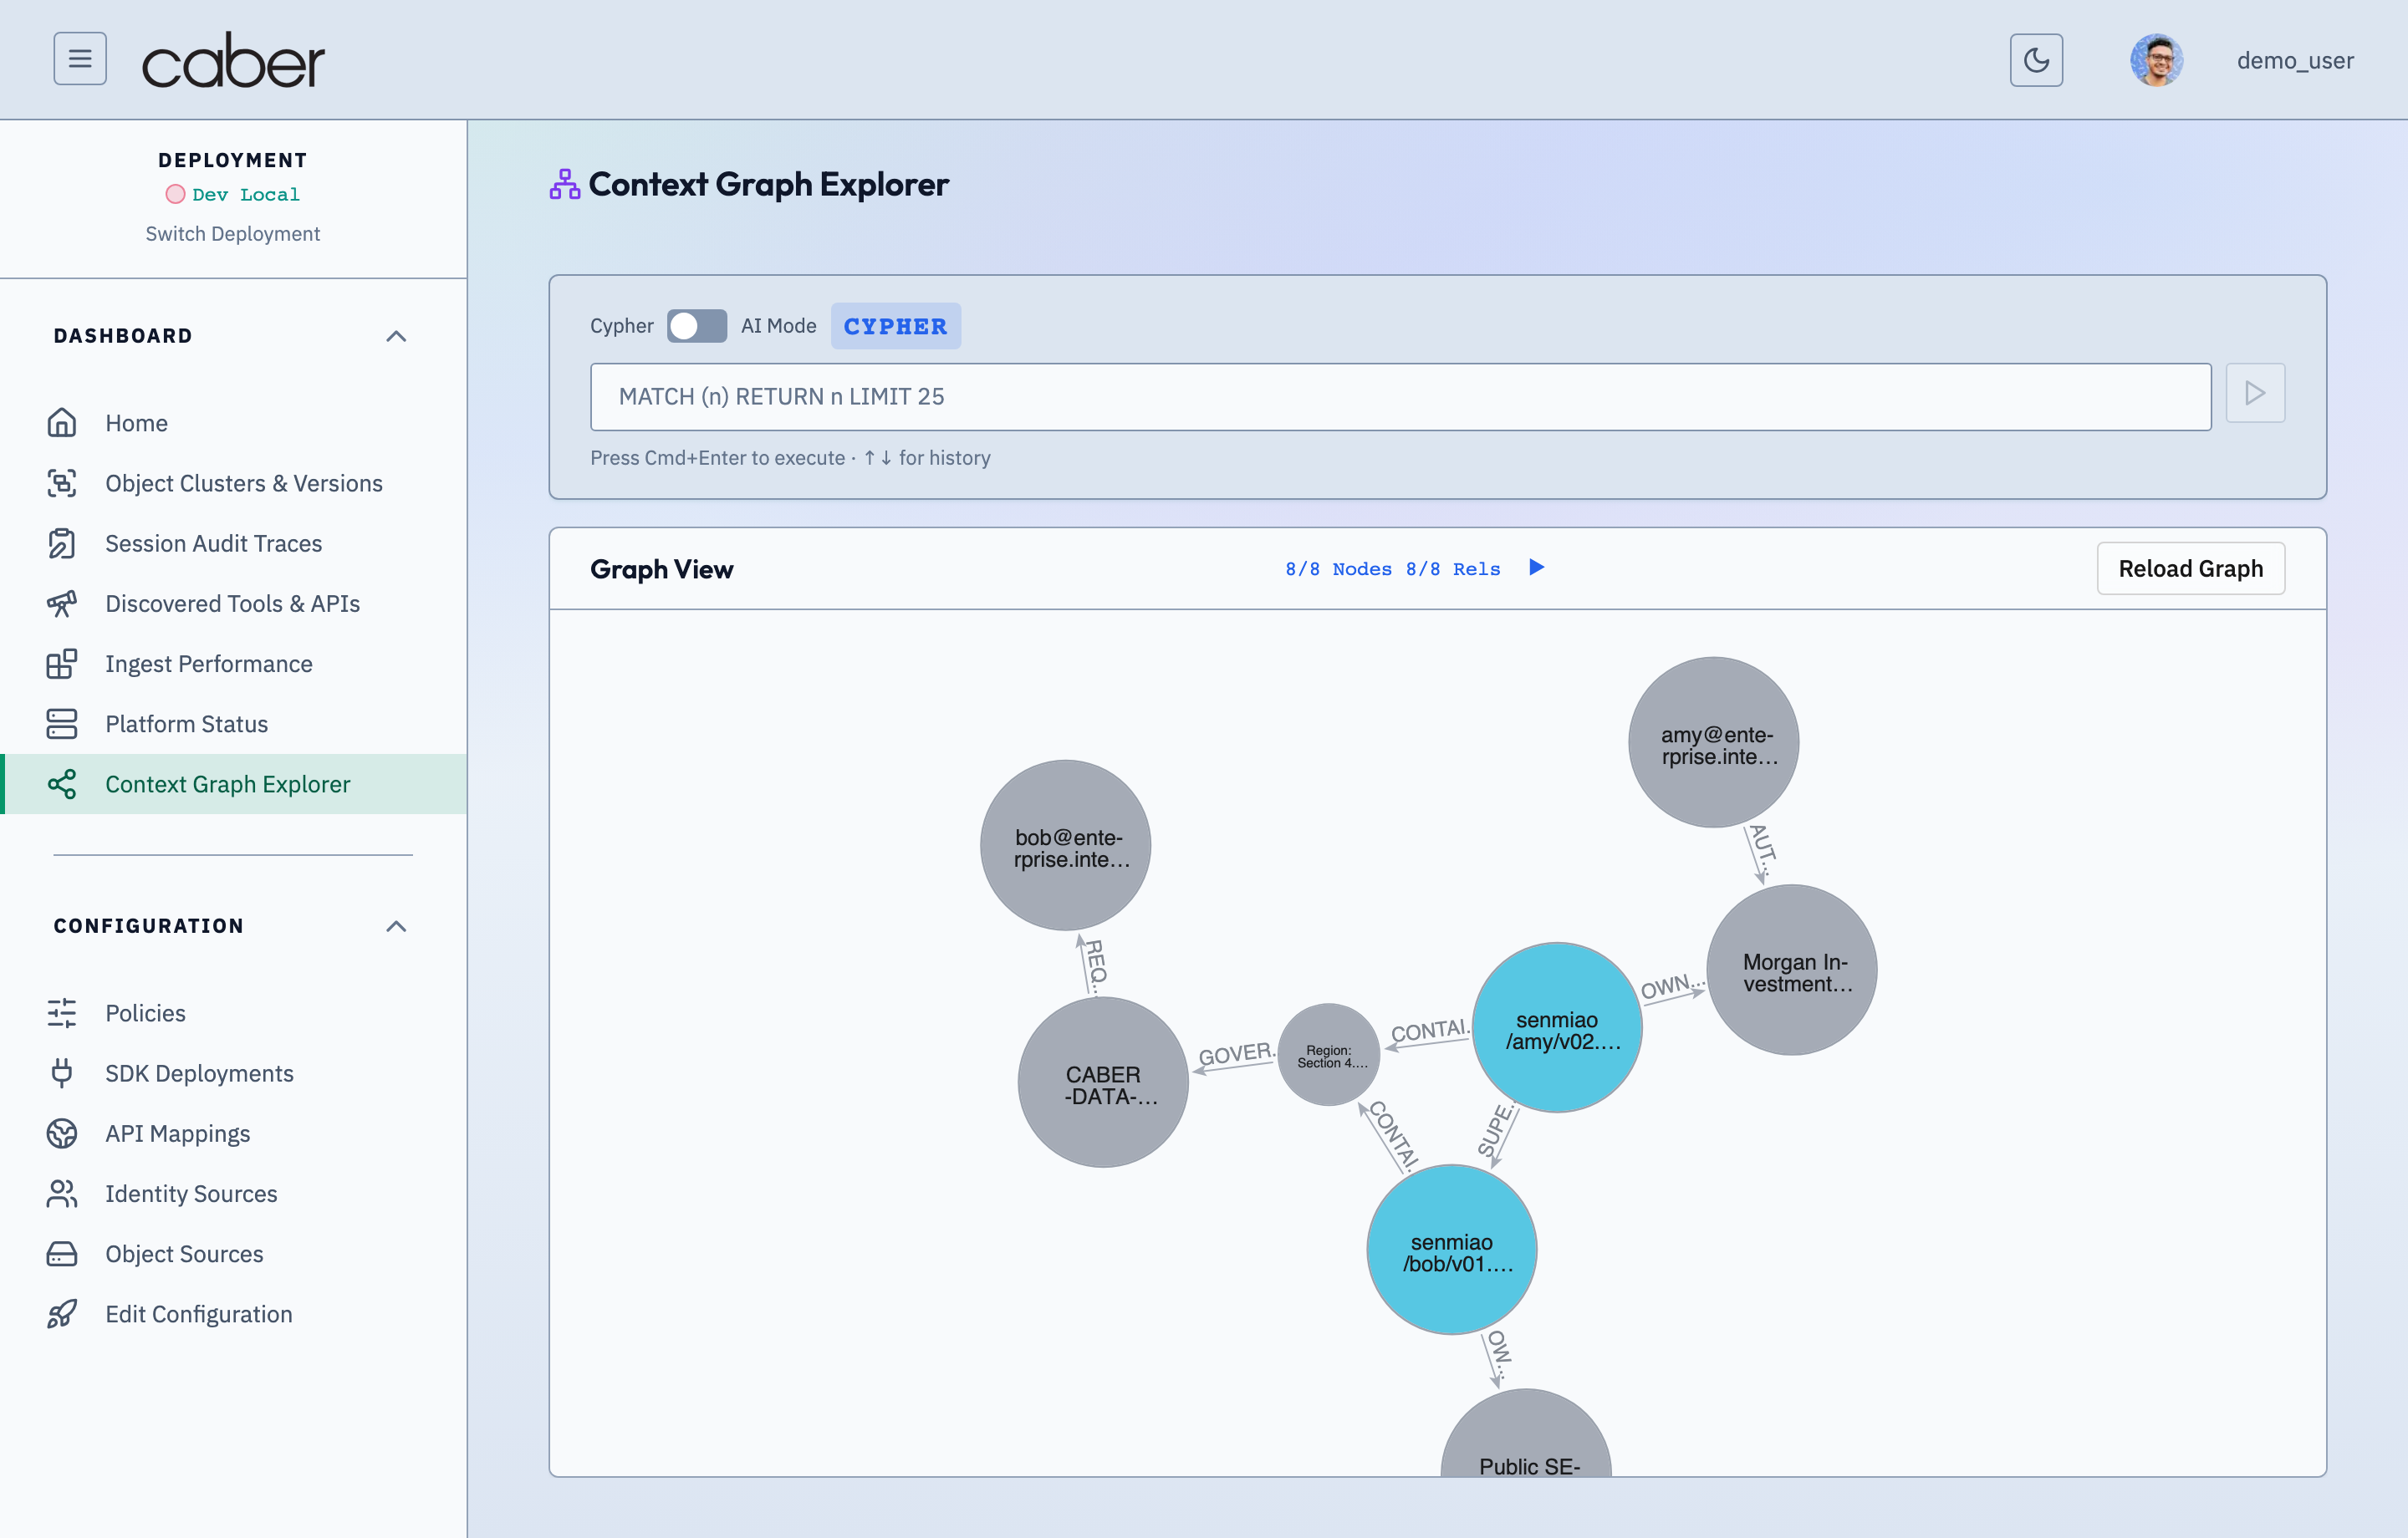
The Context Graph Explorer (/admin/contextGraph) allows operators to query and visualize the Neo4j ontological graph that links Object, Region, Organization, Person, and PolicyDecision nodes.
/admin/contextGraphNeo4j Context Graph & Ontological Provenance ExplorerAssertion Verified: Proves that identical sentence bytes in two different documents carry distinct meaning and governance verdicts depending on their ontological neighborhood (:Region NER rollup, LNKD-{xor}-{count} equivalence class, and CORI provenance).
Cypher Query Bar, AI Graph Translation, and Node Inspector
The Context Graph workspace combines query authoring with interactive graph manipulation:
- Schema Summary and Label Chips: On load, the explorer introspects
db.labels()anddb.relationshipTypes()via/api/neo4j-query, displaying clickable node label pills (Object,Region,Organization,Person,PolicyDecision) and relationship type pills (CONTAINS_REGION,SUPERSEDES,OWNED_BY,AUTHORIZED_FOR,GOVERNED_BY,REQUESTED_BY) with live entity counts. - Cypher and Natural Language Query Execution: Operators can type a raw Cypher query (for example,
MATCH (o:Object)-[r]->(t) RETURN o, r, t LIMIT 50) or use the natural language query mode to translate an English question into Cypher before executing it against Neo4j. - Interactive Cytoscape Canvas and Property Drawer: Clicking any node or relationship edge on the canvas opens the right hand property inspector showing all ontological attributes (such as
lnkd_class,byte_span,version_sequence,freshness, ordisposition), while double clicking a node expands its one hop neighborhood.
Access Authorization (/admin/accessAuth) and Data Flow (/admin/dataFlow)
Two specialized analytical views complement the Context Graph for targeted security reviews:
- Access & Authorization View (
/admin/accessAuth): Aggregates principal to resource access decisions across identity sources, highlighting where delegatedOBOscopes narrowed an agent's effective permissions compared to its service account identity. - Data Flow & Lineage View (
/admin/dataFlow): Traces how characterized regions move from upstream object stores (Object_Sources) through vector database queries (qdrant,opensearch),MCPtool responses, and outbound LLM completions.