
Session Audit & Forensics
The Session Audit page (/admin/audit) is the primary forensic investigation workspace in the Caber User Console. It correlates distributed OpenTelemetry spans, proxy wire events, On Behalf Of (OBO) identity, Context Quality Firewall (CQF) shared edges, and inline redactions into unified conversation and trace records, and it shows for every retrieval step whether each result was current, where it came from, and which policy decided what the agent received.
Session Audit Traces Table (/admin/audit)
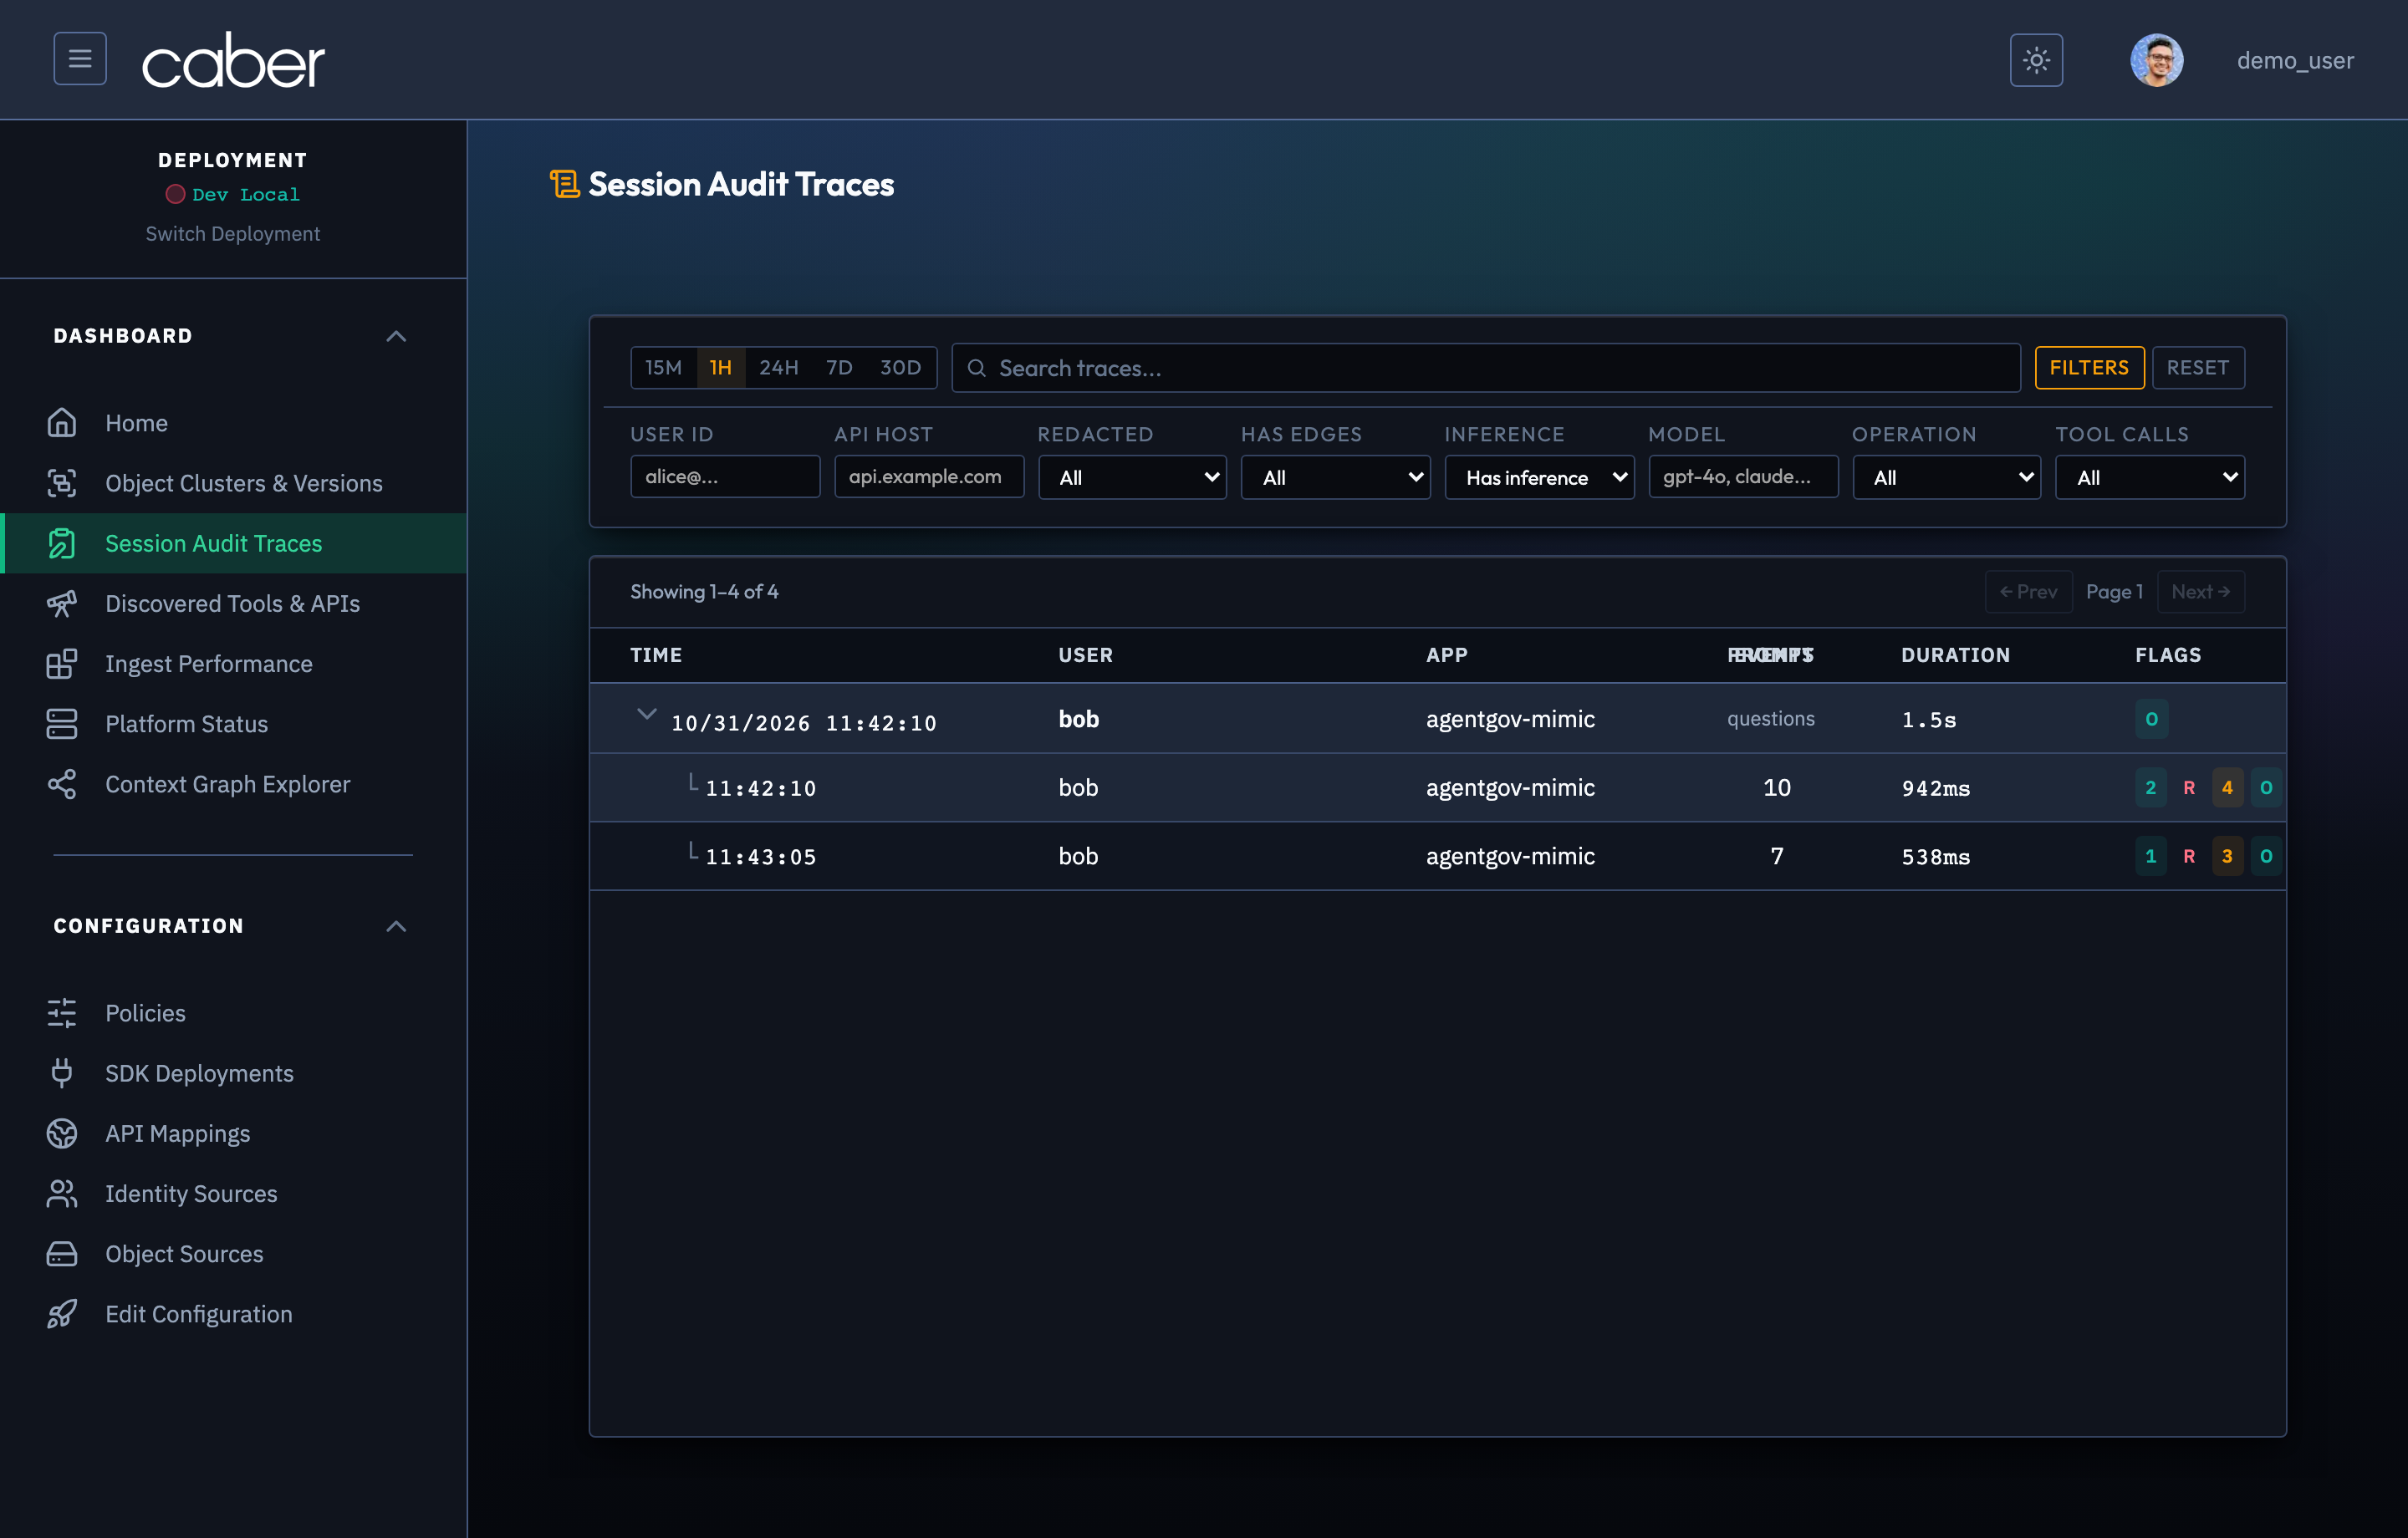
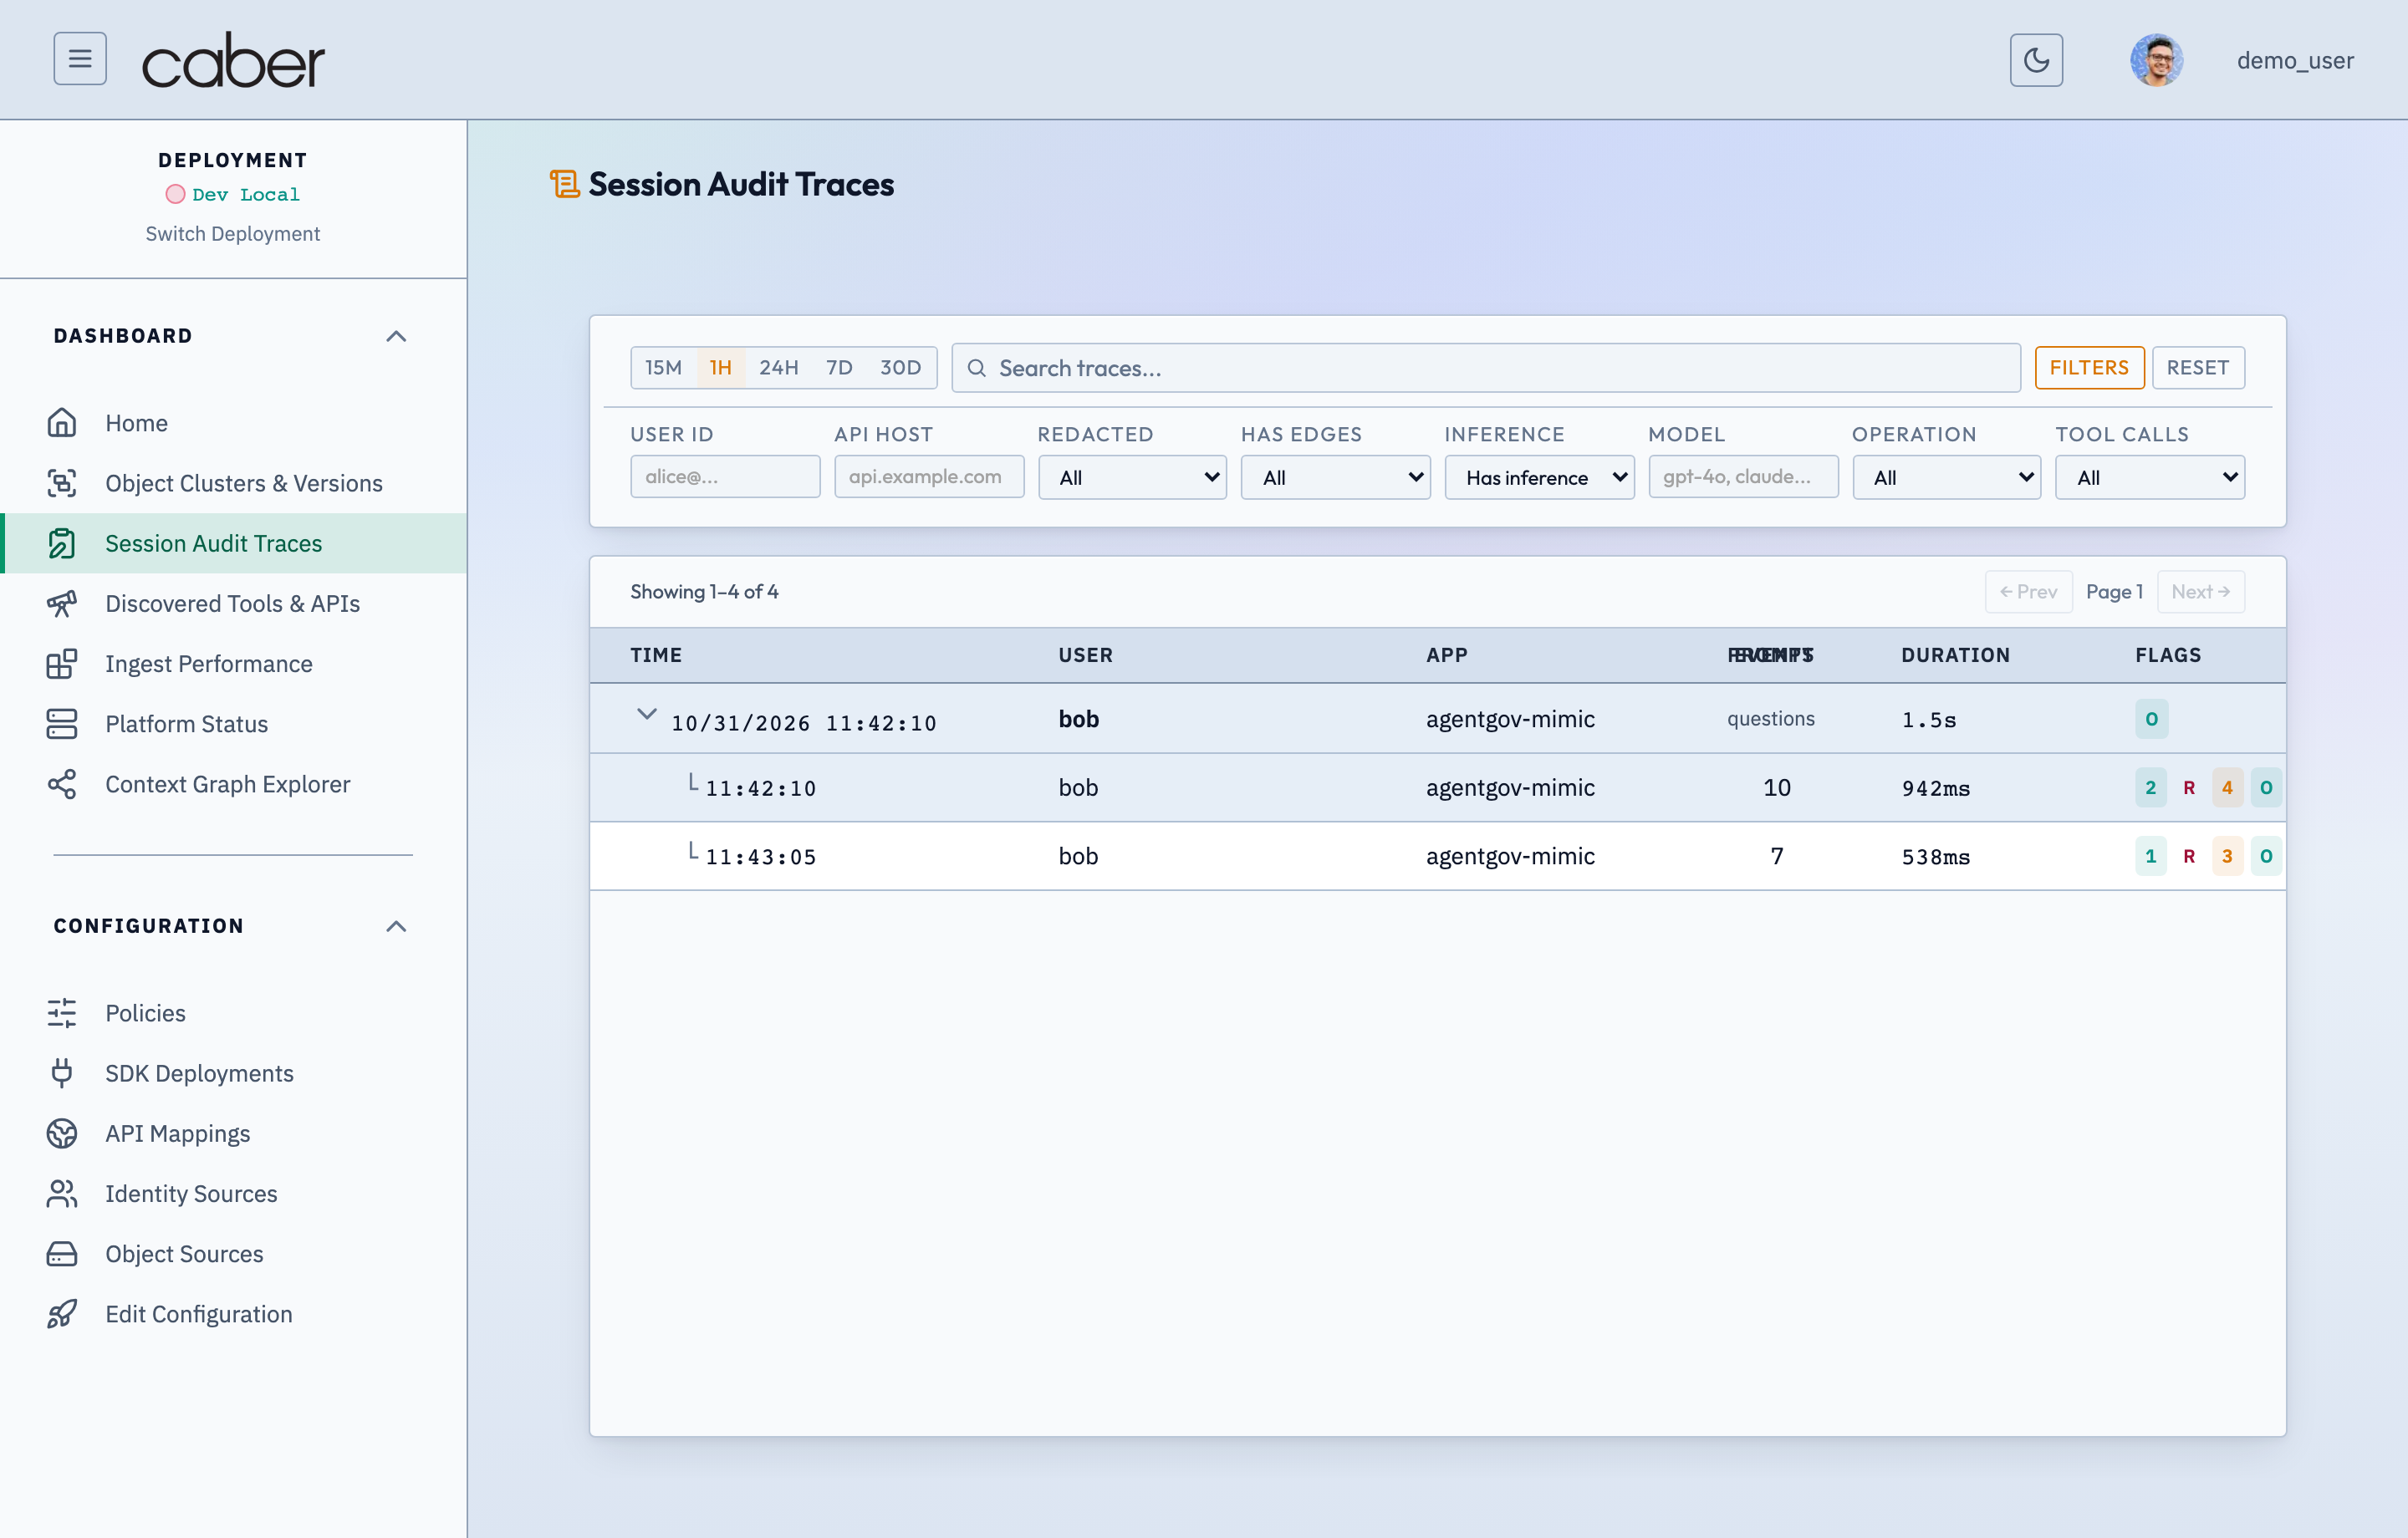
The top level /admin/audit view presents a filterable, paginated table of unified agent traces grouped by multi turn conversation.
/admin/auditSession Audit V2 Traces Table & Multi-Faceted Filter BarAssertion Verified: Proves that Session Audit V2 indexes every intercepted LLM prompt, MCP tool call, REST API request, and A2A hop with instant filtering by initiating principal, governance verdict (Allowed, Redacted, Blocked), and conversation thread.
Search, Time Range, and Filter Bar
The filter bar (FilterBar) above the traces table provides these controls:
- Time Range Presets: Restricts traces to a rolling window (
15m,1h,24h,7d, or30d), the same preset set offered on Home, Scanning, and Logs. - Search Input (
Search traces...): Free text search across the loaded traces. - Filters and Reset: Filters shows or hides the secondary filter row; Reset clears every filter and shows how many are active. Each active filter also appears as a removable chip under the bar.
- Secondary Filters: User ID, API Host, Redacted (
All,Redacted,Not redacted), Has Edges, Inference (Has inferenceorAll traces), Model, Operation (Chat,Text Completion,Embedding,Generate Content,Invoke Agent,Execute Tool,Retrieval), and Tool Calls.
Conversation Grouping vs Individual Trace Rows
The table columns are Time, User, App, Prompt, Events, Duration, and Flags. Each multi turn agent session renders as a Conversation Row (ConversationGroup) with indented Child Trace Rows (TraceRow) underneath:
- Conversation Row: Shows the chevron toggle and start time, user, app, question count, total steps, total duration, and roll up flags. Conversations start expanded; clicking the row collapses or expands its child traces.
- Child Trace Row: Shows the turn time, user, app, a scrolling prompt preview, recorded event count, duration, and flags.
- Flags Column: A teal number counts inferences,
Rmarks redacted content, an amber number counts linked data edges,Omarks an On Behalf Of chain, and child rows also show the first model name. - Opening a Trace: Clicking a child trace row (or a trace row when no conversations are grouped) opens the Trace Detail View (
TraceDetailView) as a slide in at/admin/audit?traceId=<id>. That URL is shareable and reopens the same trace directly.
Trace Detail View & Conversation Balloon Stream
The trace detail slide in combines a trace header card with a three tab forensic inspector (Trace, Waterfall, and Graph). Its purpose is to show freshness, provenance, and policy together for each retrieval step: which results were current, where each result came from, and which policy decided what the agent received. Adding &governance=open to the deep link (/admin/audit?traceId=<id>&governance=open) opens the governance decision panel on load, which is how the screenshot below is captured.
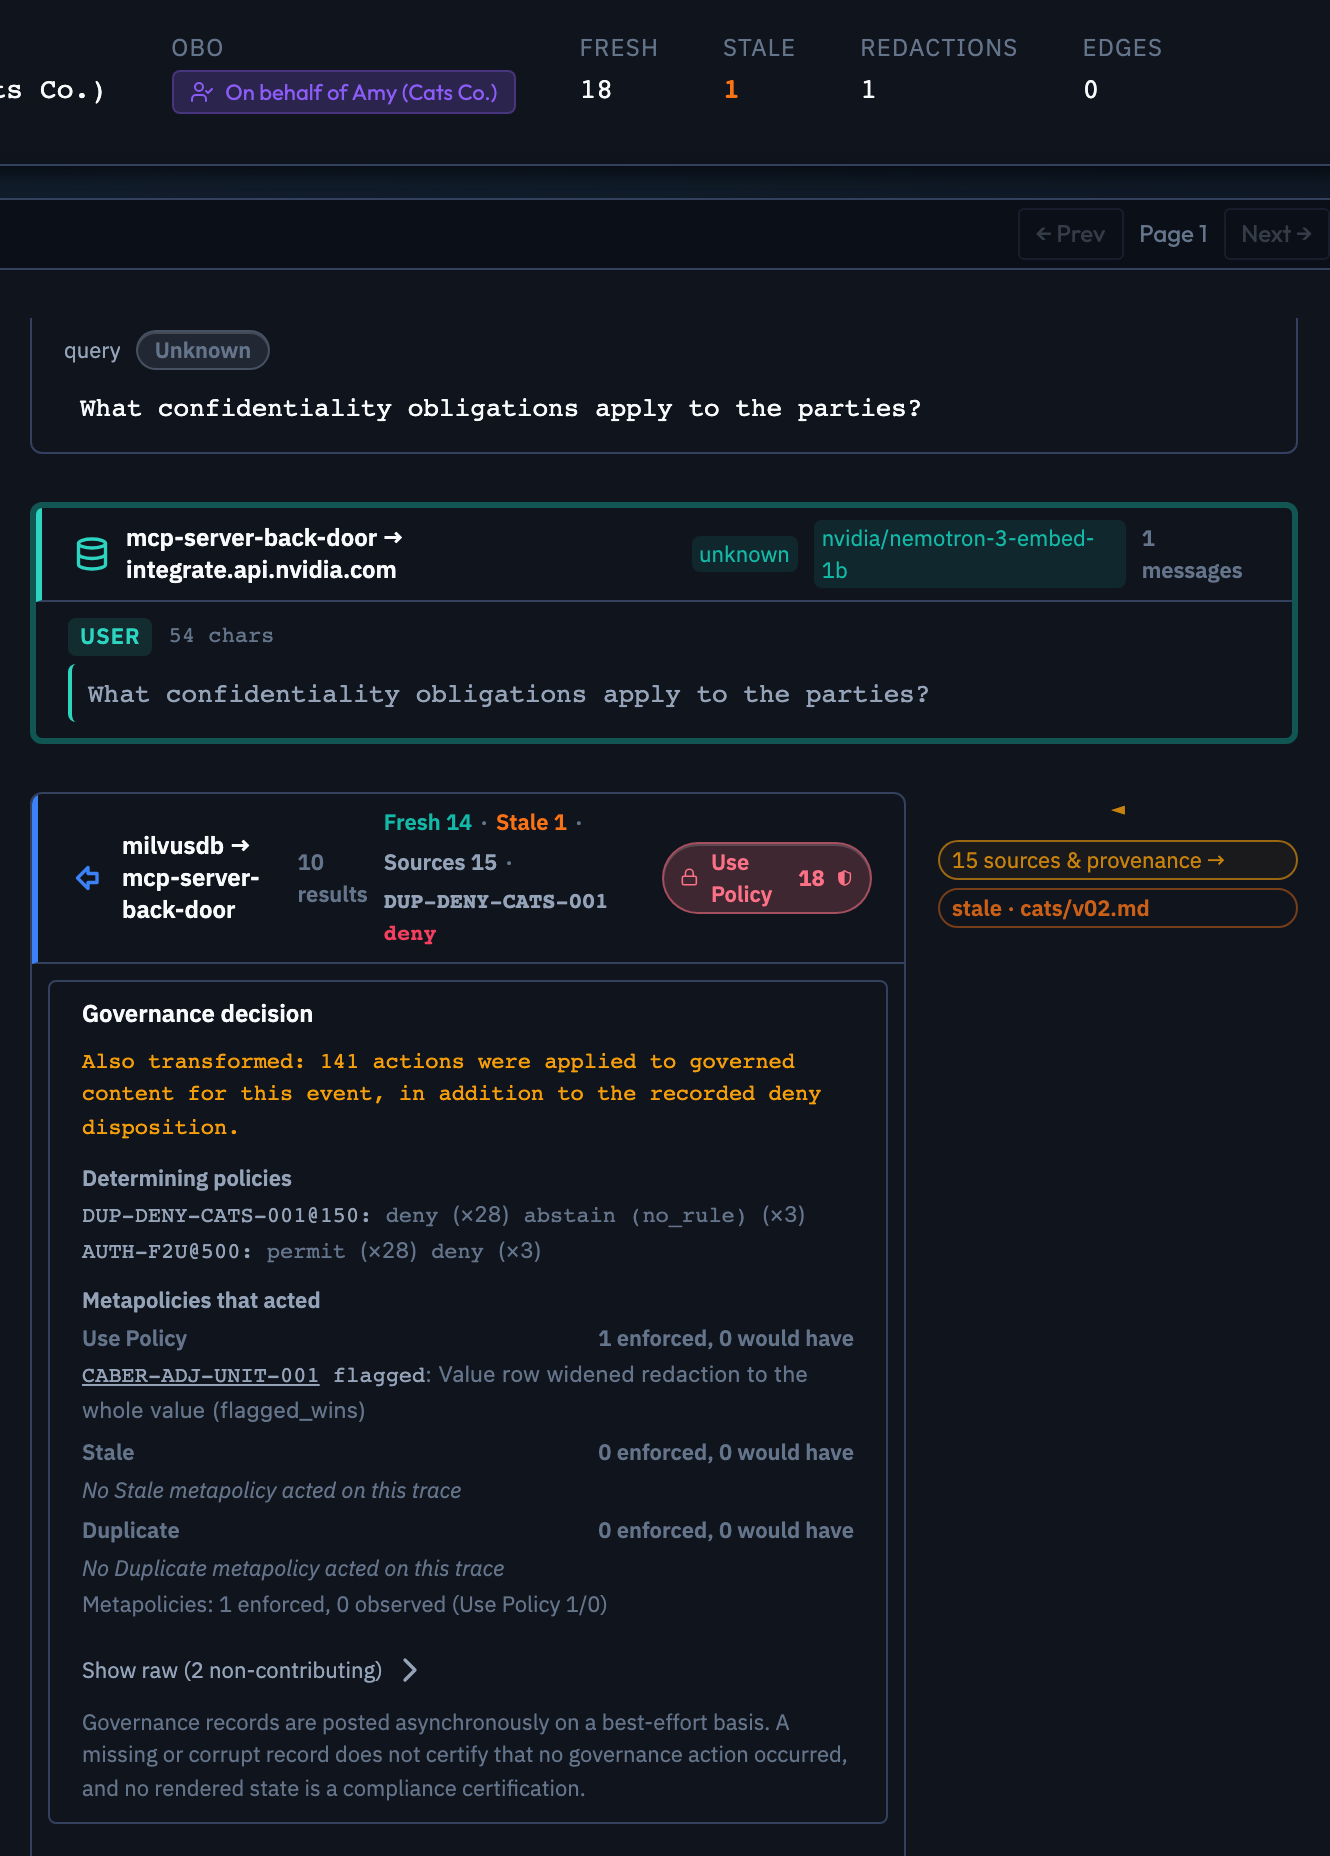
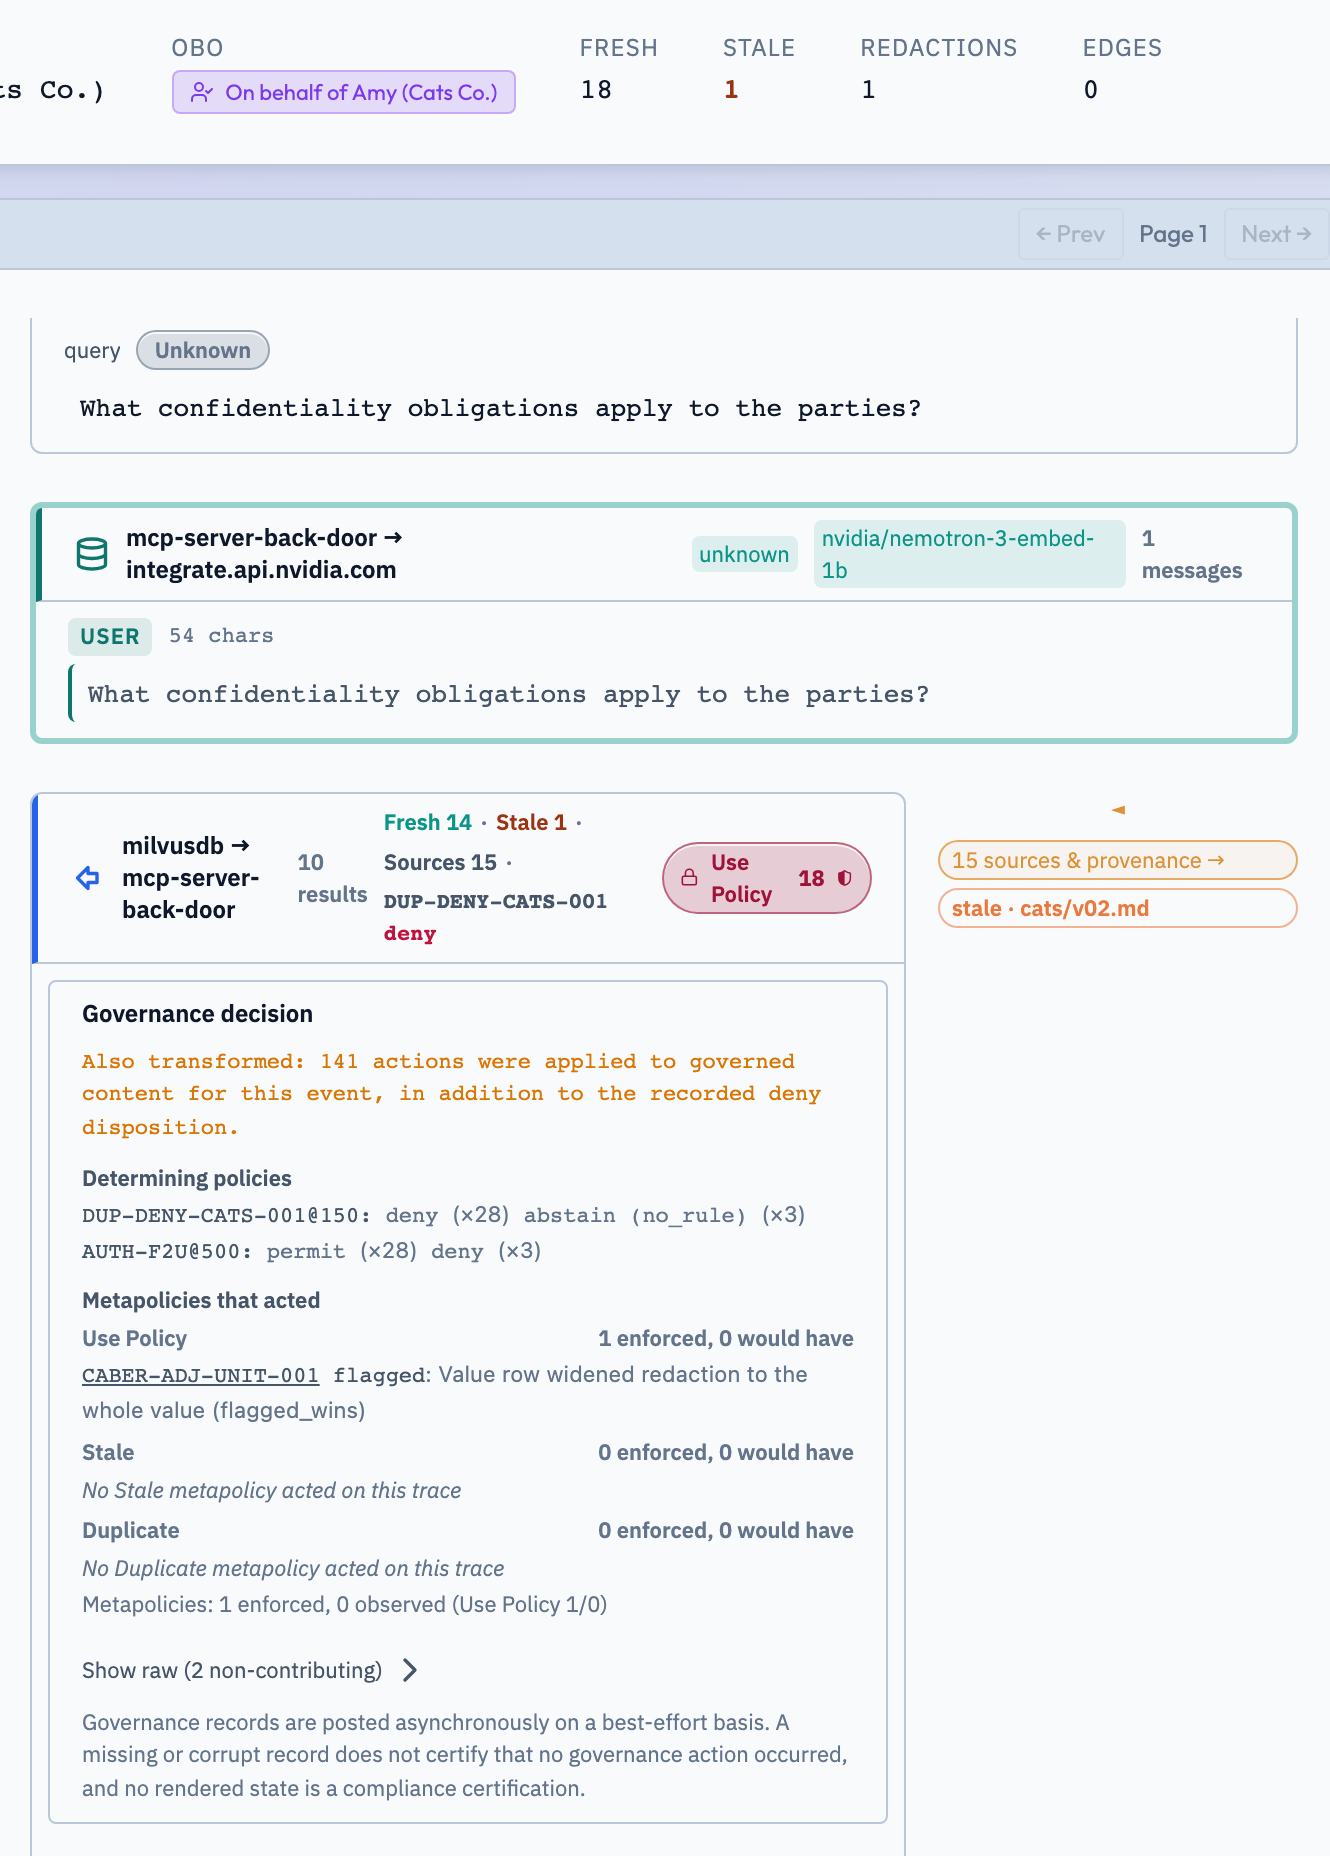
/admin/auditAudit Trace Detail: Freshness, Provenance and Policy on One Retrieval StepAssertion Verified: Proves that the console shows freshness, provenance and policy together on a single retrieval step: the evidence strip counts fresh, stale and source results, a stale chip names the source file that is out of date, a provenance chip links every source of the step to the Duplicate Tracker, and the governance panel names the determining policy, its deny verdict and which metapolicies acted.
Trace Summary Header Card
The top card summarizes the trace envelope:
- Trace Row: Repeats the table columns for this trace (Time, User, App, Prompt, Events, Duration, Flags) so the detail always matches the row that was clicked.
- Stat Row: Duration; Steps (shown as
N (M events)when paired redaction events were folded into their responses); User; Redactions; Edges; Fresh and Stale, counting the retrieved results that were current or superseded when the decision was made; and, when recorded, Inferences, Provider, Tokens, Services, and Tools. - Trace Navigation: Prev and Next step through the other traces on the current table page without returning to the table.
Conversational Balloon Stream (Trace Tab)
The default Trace tab (TraceBalloonView) reconstructs the agent turn as a chronological sequence of balloons, one per step:
- User Prompt Balloon: The inbound user prompt with its timestamp and user.
- Retrieval and Tool Steps: Vector search, MCP, and tool calls, each with its retrieved results and the governance decision Caber recorded for that step. The retrieval step header carries the evidence strip described below.
- Header Action Pills: Each step header shows one pill per metapolicy family that acted on it: Use Policy, Stale, and Duplicate, each with a count. Hovering a pill shows its status as
N detected · N enforced · N would have. The Stale pill is driven by the staleness of the step's own result blocks, so it appears whenever a returned result was superseded. - On Behalf Of Pill: When the step ran under delegated identity, an
On behalf of <user>pill names the human principal the agent acted for. - Redaction Marks (
drivervscollateral): Inside governed content Caber marks the exact byte spans that policy removed. Enforced spans are struck through over a danger tinted highlight: driver spans (the text that triggered the policy) use a solid 2px line with a heavier tint, and collateral spans (surrounding context removed with them) use a dashed 1.5px line with a lighter tint. Where both overlap, the driver mark wins. Spans that would have been removed had enforcement been on are shown with an amber underline and are never struck through. - Assistant Completion Balloon (
llm_response): The governed model response returned to the user, with a:TAINTSlineage chip beside the provenance chip when output content inherits from retrieved context.
Retrieval Step Evidence Strip
Every retrieval step header carries an evidence strip that answers the three forensic questions in one line:
Fresh N · Stale N · Sources N · <POLICY_ID> <verdict>
- Fresh and Stale count the step's results that were current or superseded when the decision was made.
- Sources counts the distinct document sources behind those results.
- Policy and verdict name the determining policy and its verdict (for example
denyorredact).
Below the strip, each result card shows the evidence behind the counts:
- Freshness Chip:
fresh(teal),stale(orange),partial(amber), orunknown, together with the basis for the state, such asstale · supersededand the version sequence. A newer version exists chip appears when a later version of the same document is known, and achanged sincenote appears when the result's freshness changed after the decision. - Version Stack: Results that belong to the same version cluster are grouped into one stack, so a superseded version sits directly beside the version that replaced it.
- Provenance Chip: Reads
N sources & provenance →and opens the Duplicate Tracker at/admin/overlappingwith every source of the step selected, showing each source inside its version cluster. When a step has no provenance record, the chip is derived from the source paths of its result blocks, so every result still links to where it came from. API payloads are excluded from the source count.
Governance Decision Panel
The Governance decision panel is read verbatim from the immutable decision event. It opens on load when the deep link carries governance=open and lists:
- Determining policies: Each policy that decided the event, as
POLICY_ID@priority: verdict. When no policy decided the event the panel says so. - Version action, superseded text, and Purpose: What Caber did with superseded versions, which text was superseded, and the declared purpose of the request, shown without expanding raw detail.
- Would have rows: Decisions that were observed but not applied, with the disposition that was recorded instead.
- Metapolicies that acted: Grouped by family (Use Policy, Stale, Duplicate), each with
N enforced, N would have. - Show raw: Expands non contributing policies, the policy set fact chain, and work counts.
Execution Waterfall Timeline (Waterfall Tab)
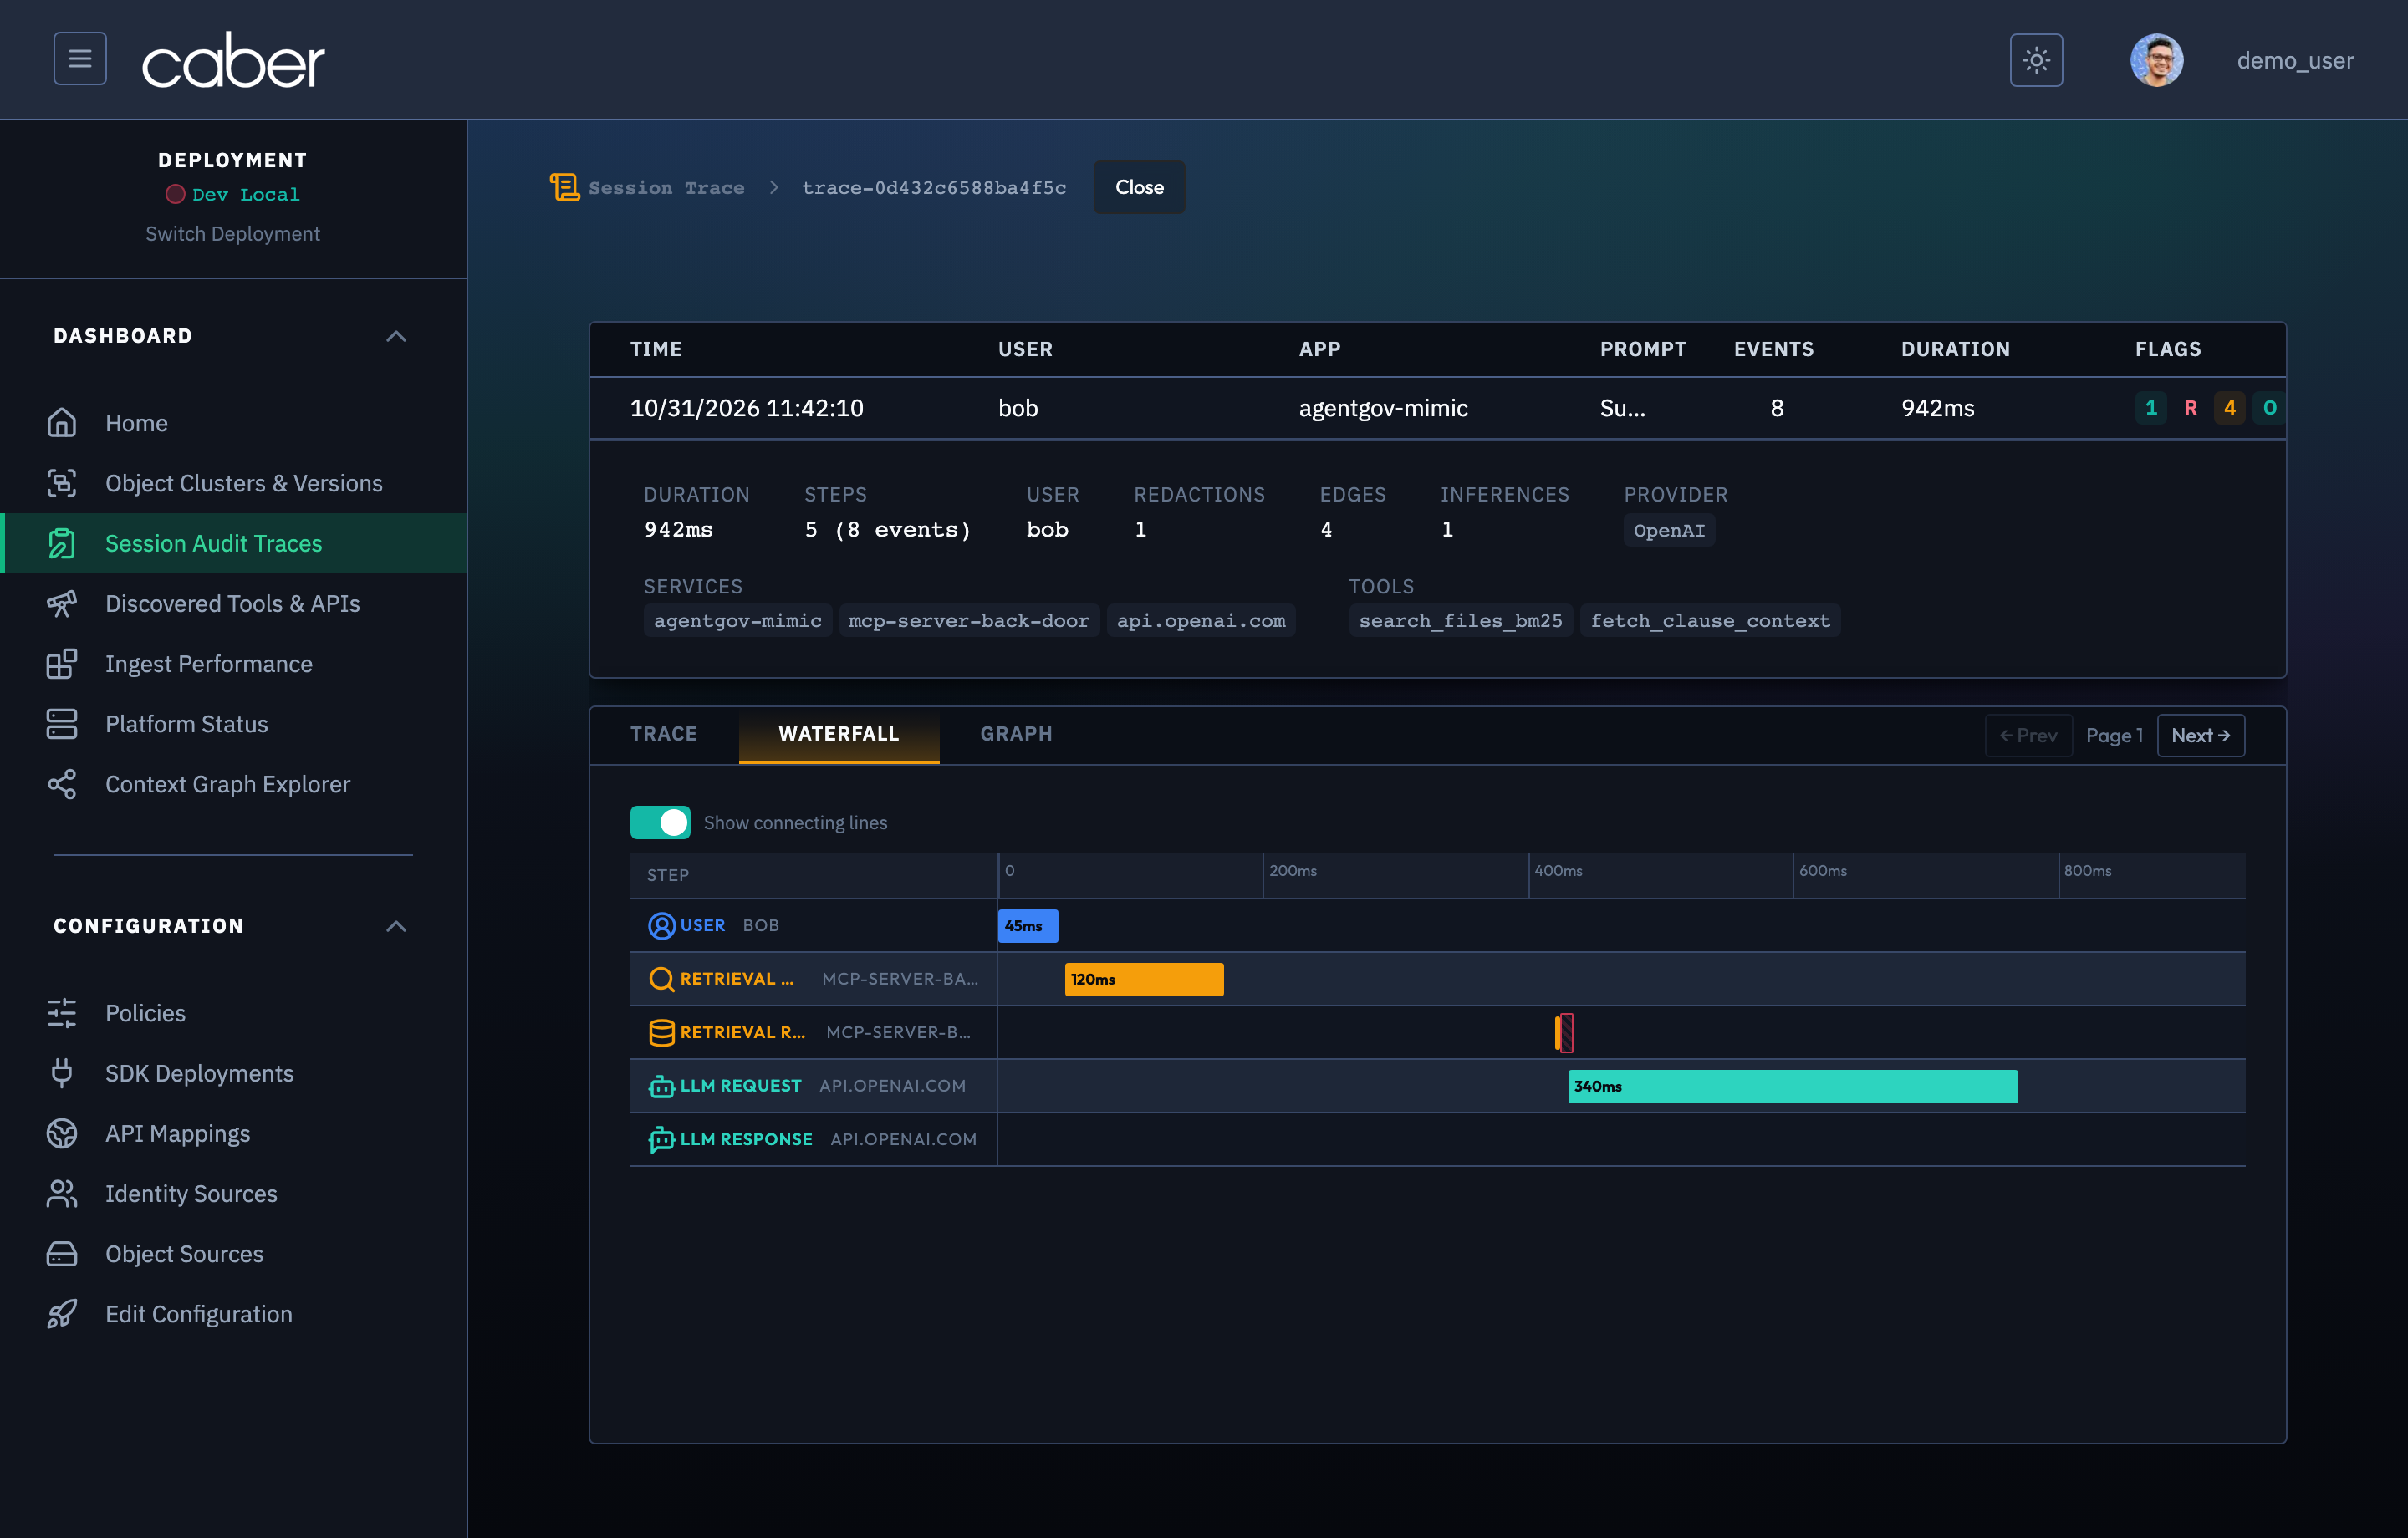
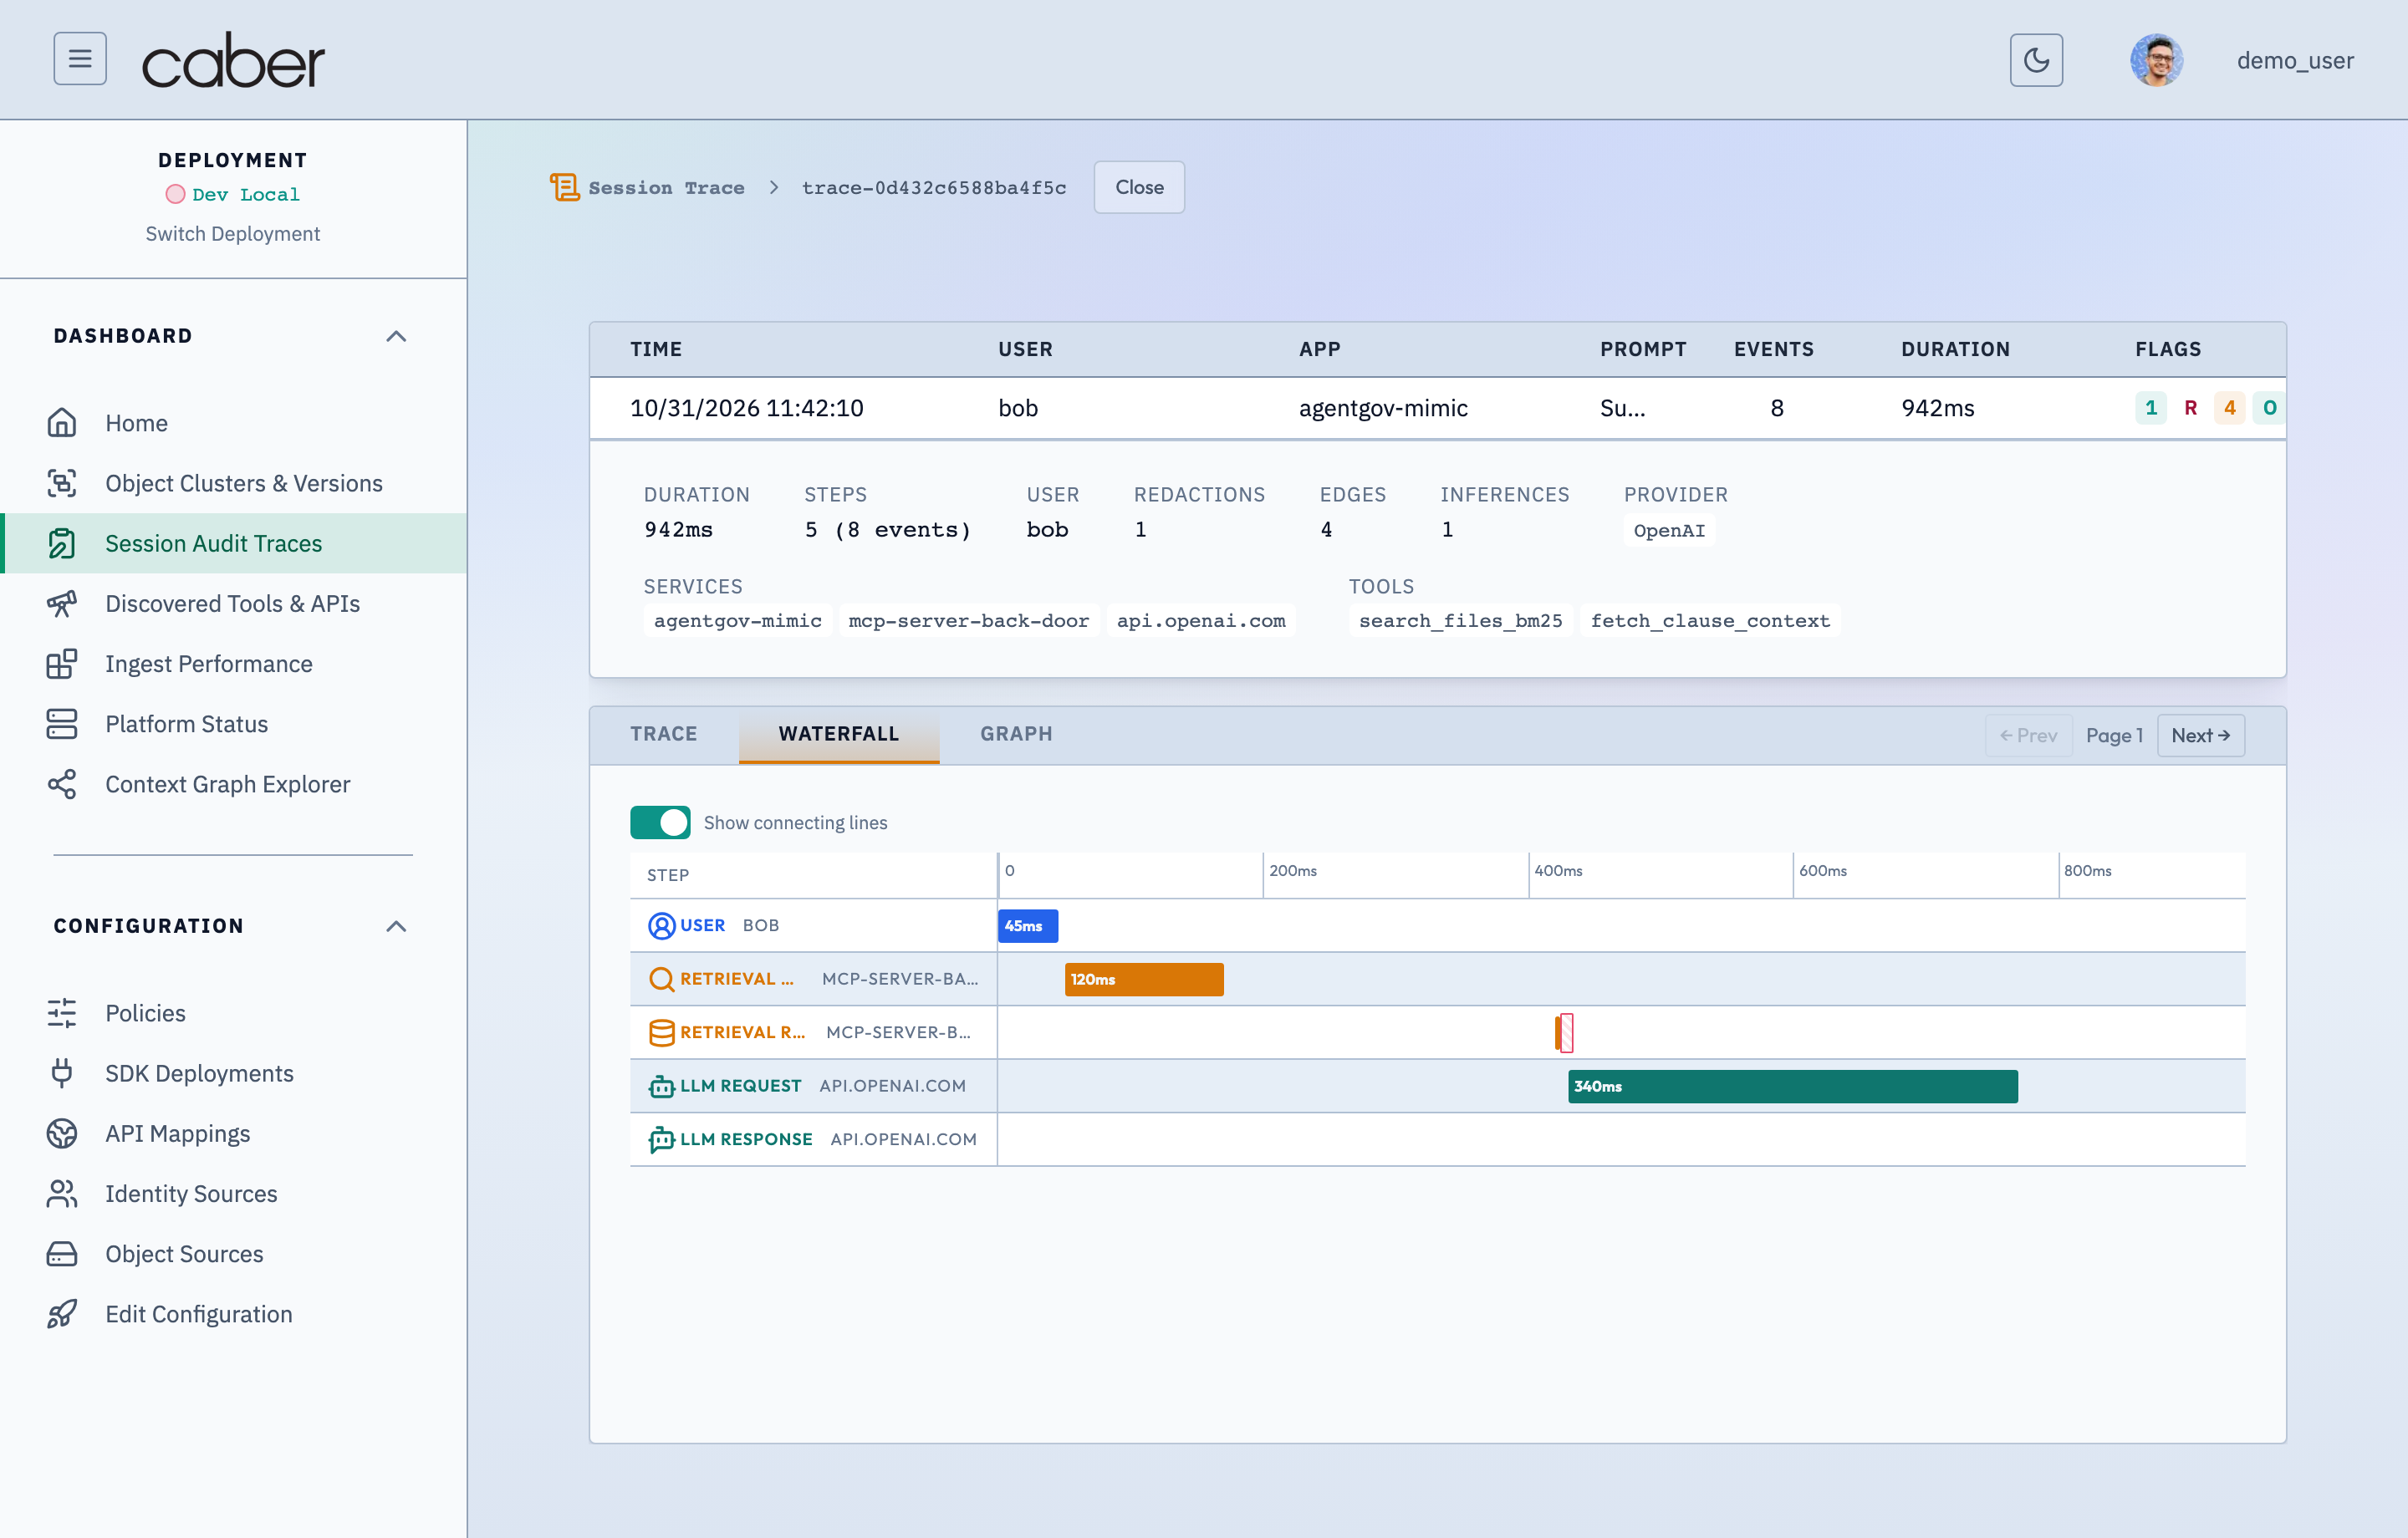
Switching to the Waterfall tab (WaterfallTab) renders a high precision horizontal Gantt timeline of every step in the unified trace.
/admin/auditSession Audit Trace Detail — Multi-Hop Latency Waterfall ViewAssertion Verified: Proves that the Waterfall tab inside the Trace Detail view decomposes end-to-end request latency across every agent hop, MCP tool invocation, RBIX fingerprint lookup, and Contract v3 Wasm Rego evaluation.
- Step Rows & Timing Bars: Each trace step (
API-STEP-1throughAPI-STEP-5) is plotted against the total trace duration (862 ms), showing exact start offset, step duration (48 ms,185 ms,72 ms,340 ms,167 ms), event class badge (user_prompt,mcp_call,caber_decision,llm_request,llm_response), and target host. Show connecting linesSwitch: TogglingShow connecting linesin the waterfall toolbar draws causal SVG Bezier curves between parent and child steps that shareedge_flowprovenance edges or OpenTelemetry parent span references.- Inline Step Payload Expansion: Clicking any step bar in the waterfall expands a structured key value inspector underneath that step, showing its raw headers,
OBOclaims, correlation mechanisms (otel,obo,edges,taints), and linkededge_ids.
Causal Provenance Graph (Graph Tab)
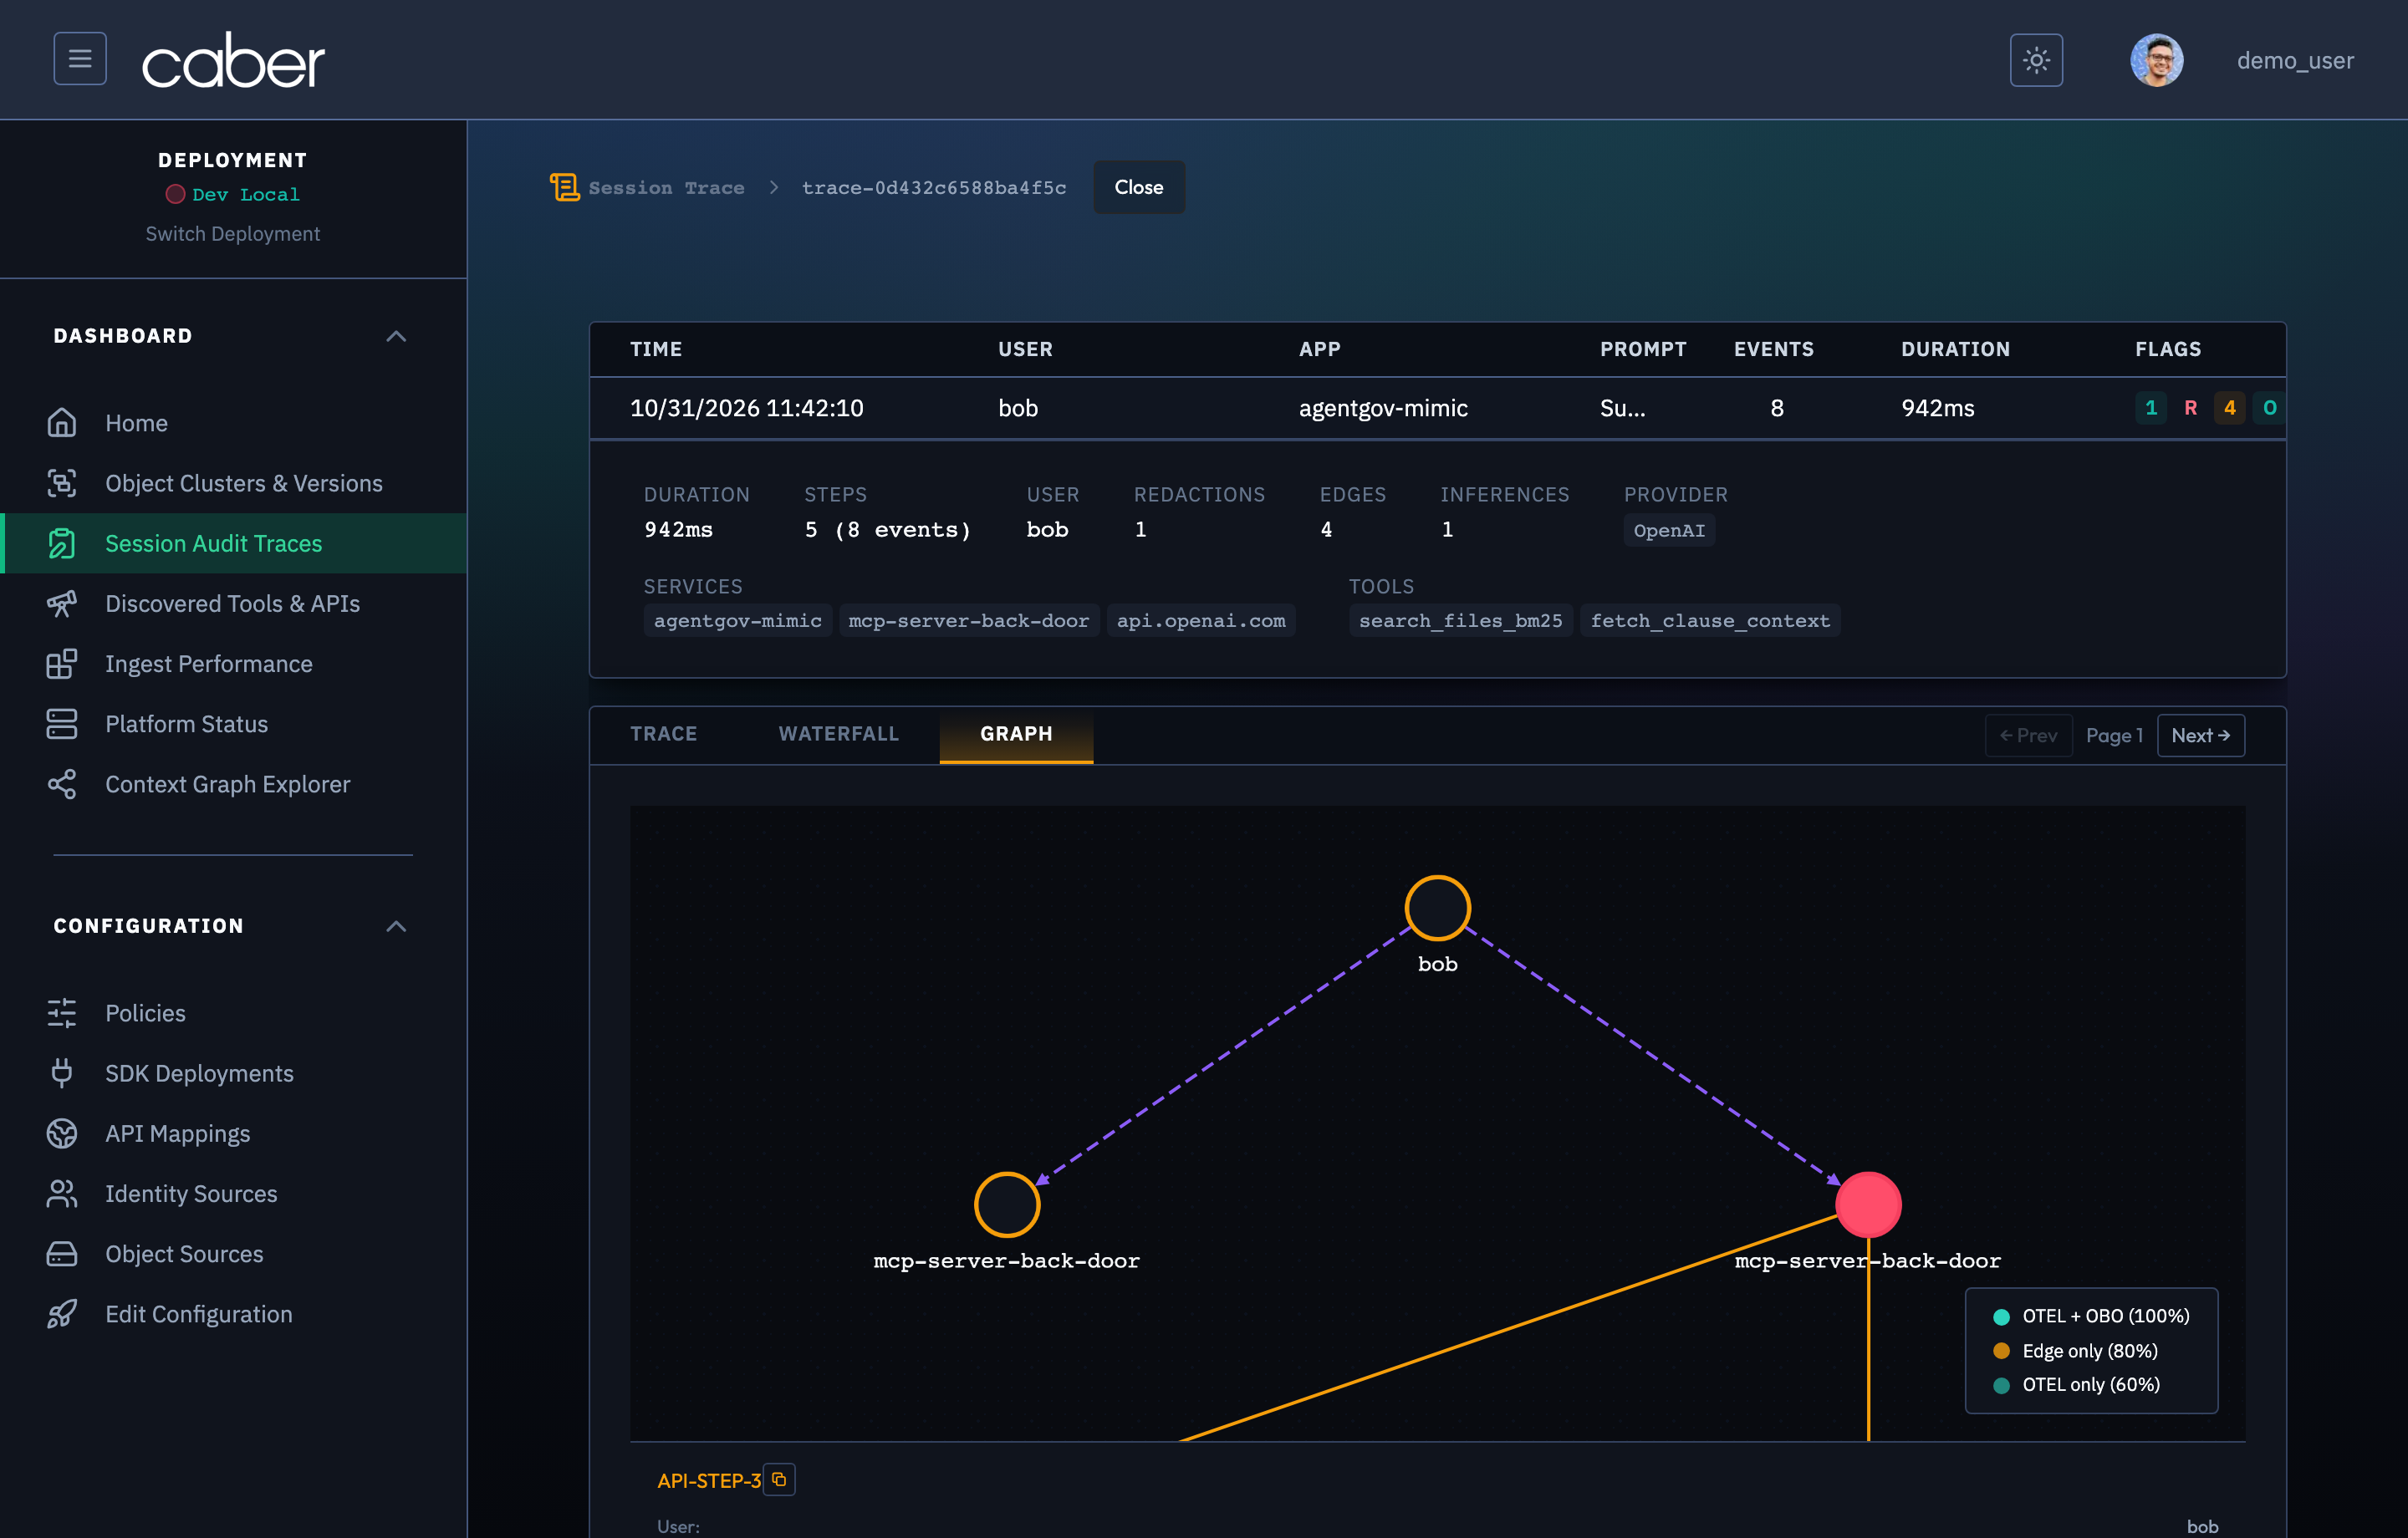
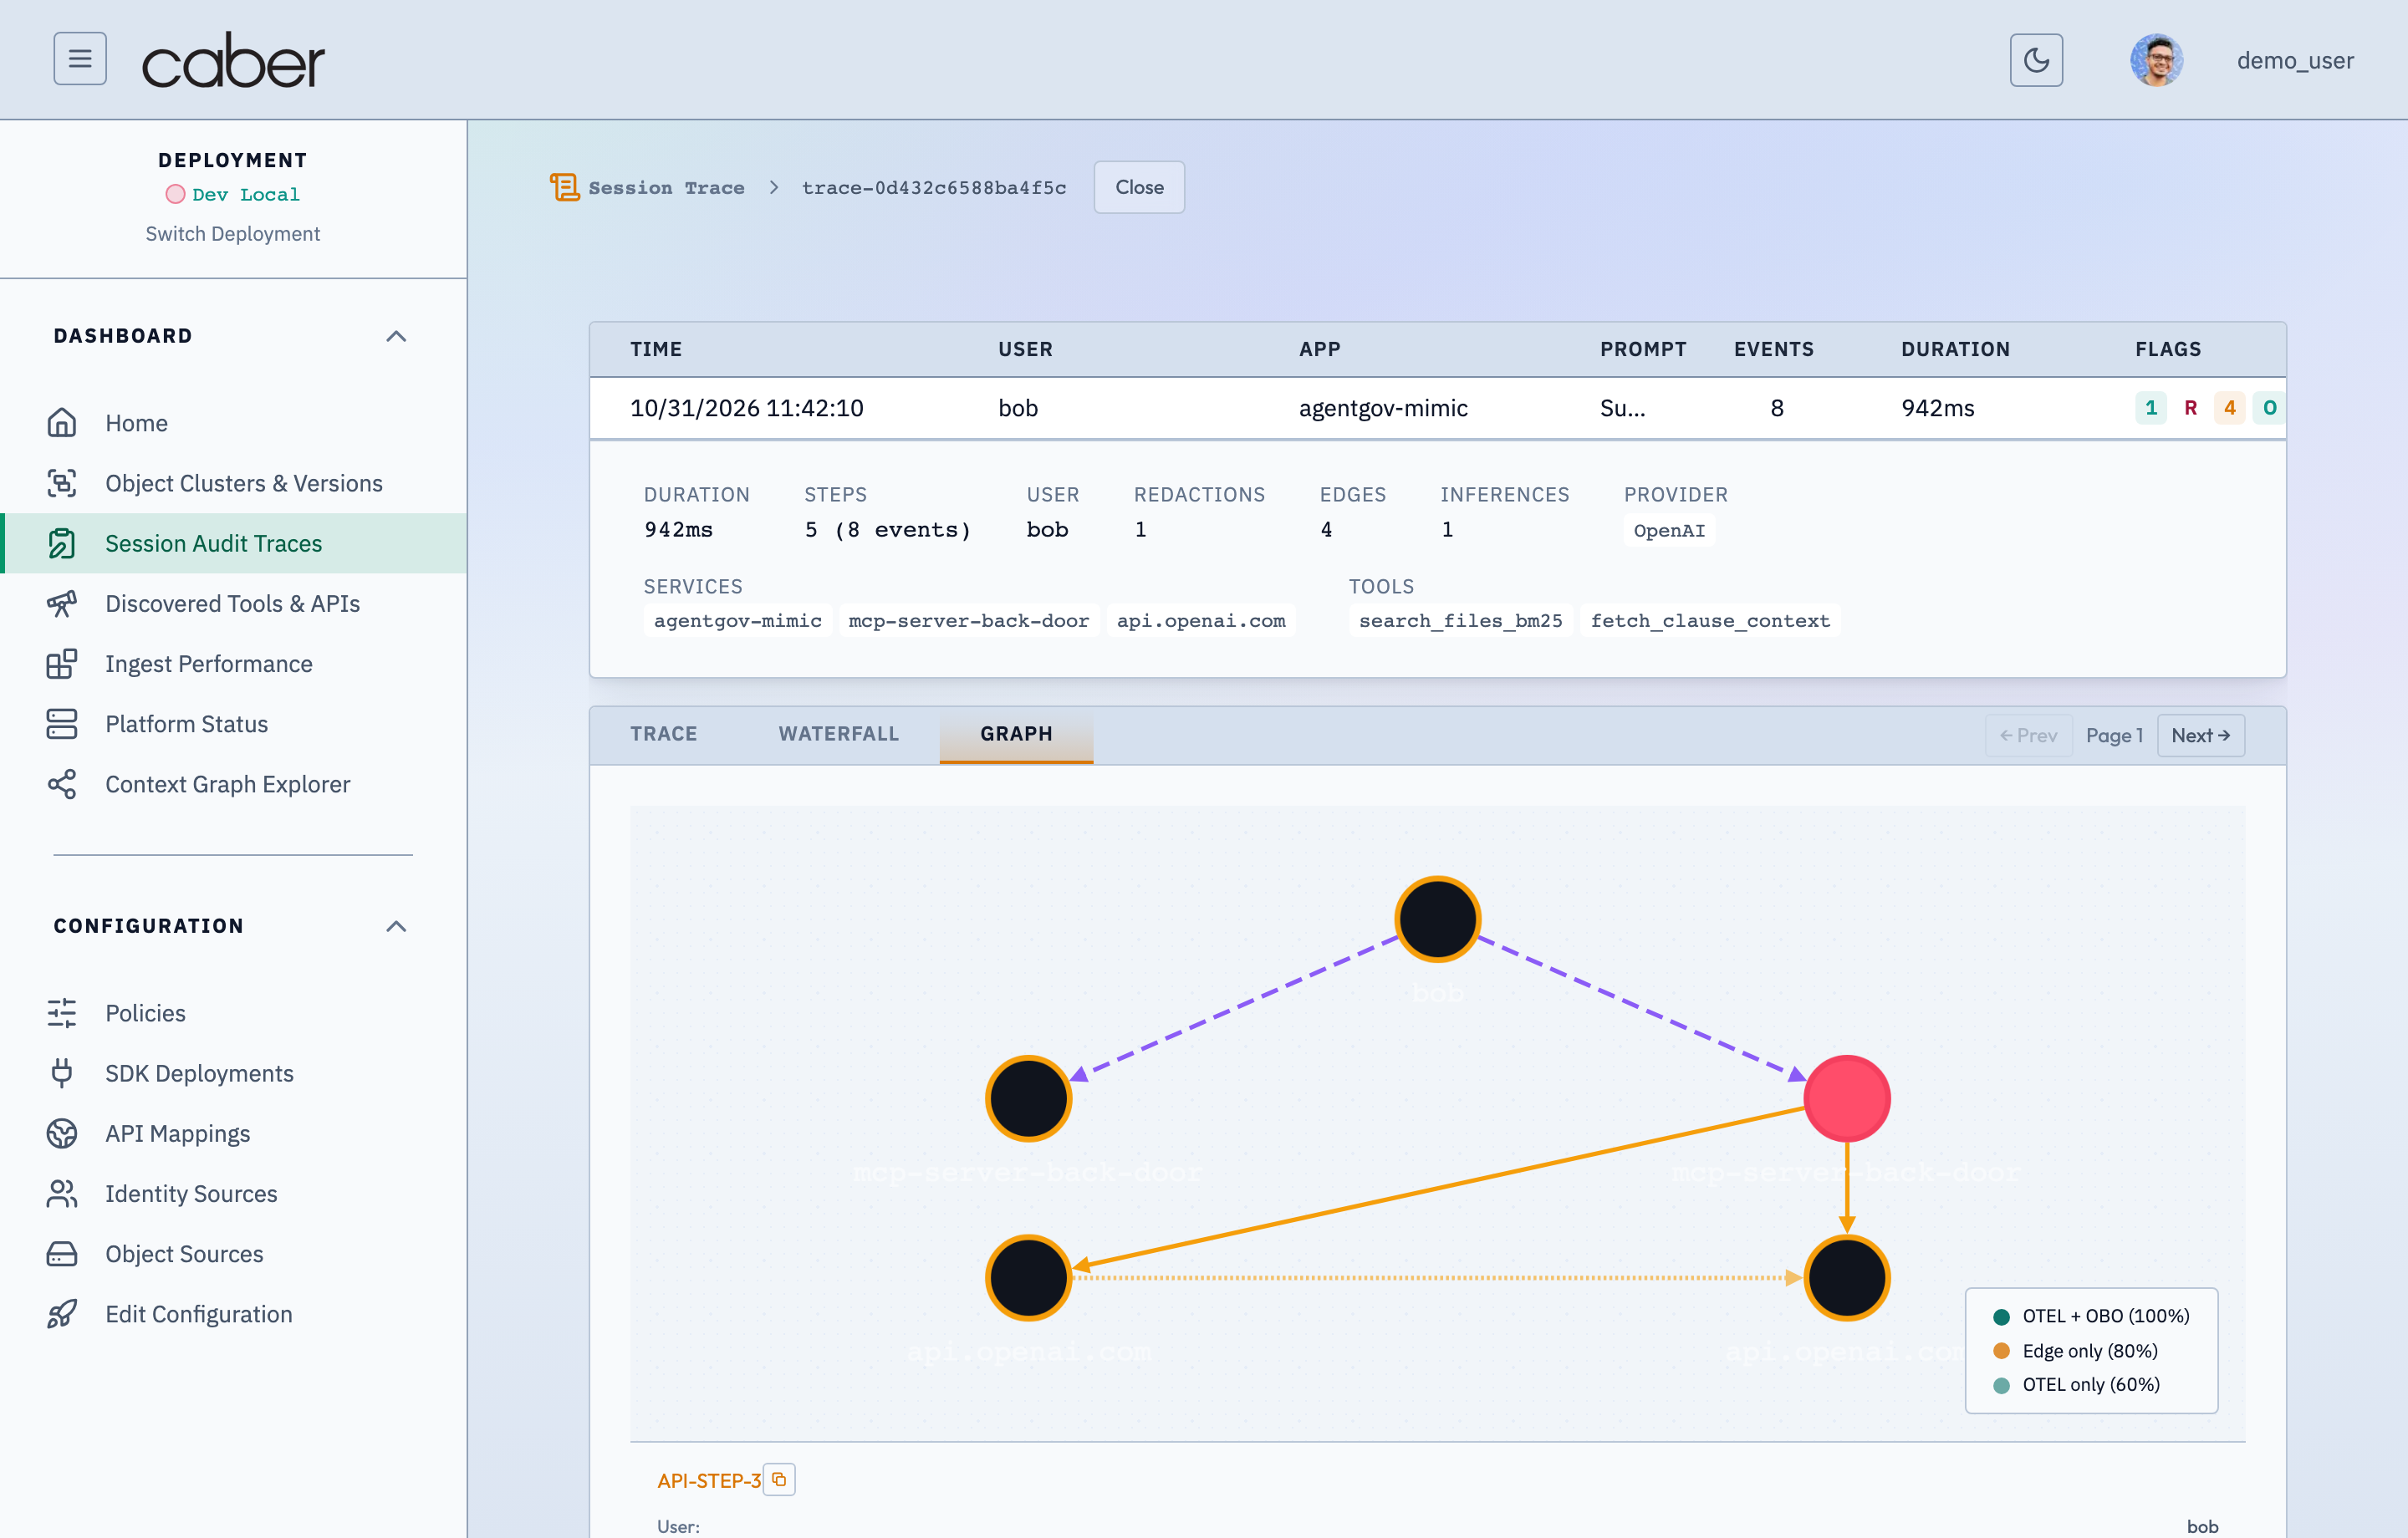
Switching to the Graph tab (GraphPanel) renders an interactive Cytoscape causal provenance graph of the trace steps and their correlation edges.
/admin/auditSession Audit Trace Detail — Interactive Execution Graph & Node InspectorAssertion Verified: Proves that the Graph tab renders the complete causal execution DAG for a traced session and allows operators to click any hop node (such as a redacted API or MCP step) to inspect its specific Verdict Snapshot v3 and payload attributes.
- Node Visual Encoding:
- Standard trace steps render as circular nodes with amber borders (
--accent-amber) labeled by target service or entity name. - Steps where surgical redaction occurred (
wasRedacted: true, such asAPI-STEP-3) render with a crimson border and translucent crimson fill (--accent-red). - OpenTelemetry span events (
span_*) render with dashed borders.
- Standard trace steps render as circular nodes with amber borders (
- Correlation Mechanism Legend: The bottom right legend encodes the confidence hierarchy of trace links via node and edge opacity:
- OTEL + OBO (
100%): Solid teal indicator for steps linked by both cryptographicOBOdelegation tokens and OpenTelemetry trace context. - Edge only (
80%): Amber indicator for steps linked via CQF content overlap or:TAINTSlineage edges (LNKD-3201037662-31,LNKD-9941208812-18). - OTEL only (
60%): Muted teal indicator for steps correlated solely by distributed trace headers.
- OTEL + OBO (
- Bottom
NodeDetailInspector: Clicking any node in the graph opens the bottomNodeDetailbar, displaying the step'sapi_id(with a copy button), resolvedOBOuser (bob), host (caber-guardrail-proxy), timestamp, direction,:TAINTSlineage summary, andREDACTEDstatus badge.
How the Trace Detail Screenshot Is Captured and Verified
The audit_trace_detail screenshot is only accepted when the capture can prove it shows a fully loaded trace with freshness, provenance, and policy on screen.
- Capture: In
CaberUserConsole,npm run capture:trace-detailopens/admin/audit?traceId=<id>&governance=openin both themes, waits for each required selector, and writestrace-detail-screen.png(dark),trace-detail-light.png(light), one<name>.capture.jsonsidecar per image, and acaptures.jsonindex. - Sidecar: Each sidecar records the slot, theme, trace, route, deep link, capture time, console commit, viewport, the selectors waited for, the evidence counts (
freshCount,staleCount,sourceCount), the determiningpolicyIdandpolicyVerdict, thesourcePaths, whether loading markers were absent, and thesha256of its PNG. - Update: The updater copies the images only if every sidecar satisfies the slot's
requiredEvidence; otherwise it prints why and writes nothing. - Verify:
--verifyfails the slot when either theme lacks evidence, when a sidecarsha256does not match the image on disk, when loading markers were present, when a required selector is missing fromwaitedFor, or when the stale count, source count, or verdict falls short.
# In CaberUserConsole
npm run capture:trace-detail

# In caber-internal-docs (paths in captures.json resolve relative to that file)
.venv/bin/python scripts/update_screenshots.py --from-manifest <capture-dir>/captures.json
.venv/bin/python scripts/update_screenshots.py --verify
The slot requires these selectors: [data-testid="trace-detail"][data-trace-state="ready"], [data-testid="evidence-strip"], [data-testid="governance-decision-panel"], [data-testid="freshness-chip"][data-freshness="stale"], and [data-testid="provenance-chip"], plus at least one stale result, at least one named source, and a deny or redact verdict.